
 23.01.2024 10:25 AM
The economic calendar commonly lacks high-impact economic data on Monday. Yesterday was no exception. The US, the UK, and the EU did not release any economic reports.
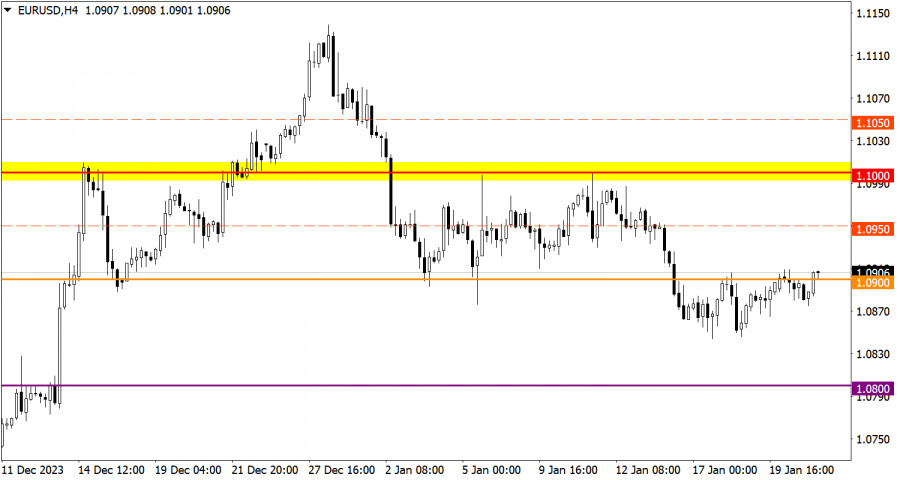
The EUR/USD pair has been moving around the 1.0900 level for the third day in a row with low trading activity. The level of 1.0850 serves as a variable support on the path of sellers. At this level, there was a reduction in short positions on EUR/USD.
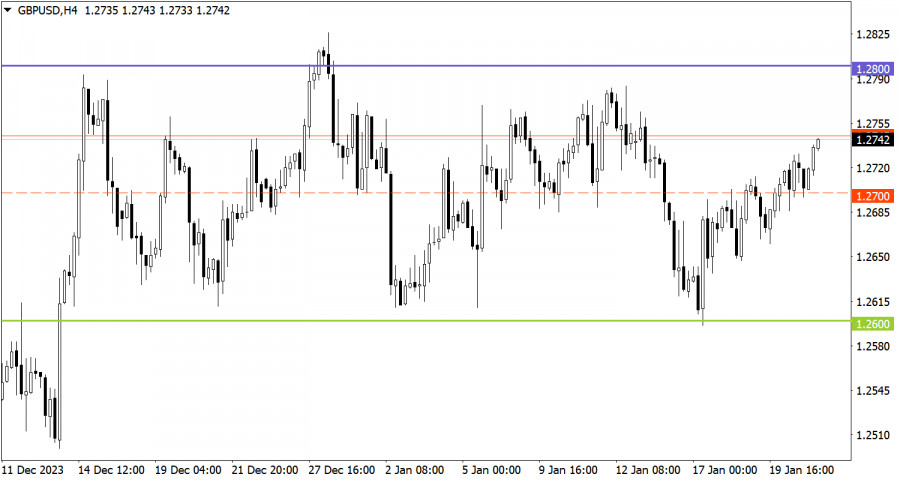
The GBP/USD currency pair is trading within the sideways channel of 1.2600/1.2800, consistently approaching the defined borders. At the moment, we see the consolidation above the average level of 1.2700, which indicates an increase in long positions on the range-bound market.
Today the economic calendar is equally empty as on Monday. No macroeconomic data will be released in the US, the UK, and the EU.
Consolidation of the price above 1.0900 during the day may lead to an increase in the volume of long positions in the direction towards 1.1000. As for the bearish scenario, it will come into play if the price drops below 1.0850.
In this situation, we may go ahead trading within the borders of the sideways channel. We reckon the instrument could approach the upper border at 1.2800.
However, we should not forget that the range-bound market is a temporary pattern, which leads to the accumulation of trading forces and abundant attention from speculators. As a result, the instrument will gain a certain momentum and break any of the borders. When the flat market is over, the price will indicate a further direction in the market. For this reason, you should always consider the breakout strategy.
The candlestick chart type consists of graphic rectangles in white and black with lines at the top and bottom. With a detailed analysis of each individual candle, you can see its characteristics relative to a particular time frame: opening price, closing price, maximum and minimum price.
Horizontal levels are price coordinates relative to which a price may stop or revered its trajectory. In the market, these levels are called support and resistance.
Circles and rectangles are highlighted examples where the price developed. This color highlighting indicates horizontal lines that may put pressure on the price in the future.
Up/down arrows are guidelines for possible price direction in the future.
You have already liked this post today
*The market analysis posted here is meant to increase your awareness, but not to give instructions to make a trade.
لم يظهر زوج الجنيه الإسترليني/الدولار الأمريكي أي تحركات مثيرة للاهتمام يوم الجمعة. مثل اليورو، بقي الجنيه البريطاني قريبًا جدًا من نطاق ثابت. ومع ذلك، لا تزال العملة البريطانية تحافظ
واصل زوج العملات EUR/USD التداول بشكل جانبي يوم الجمعة. يستمر السوق في تجاهل جميع البيانات الاقتصادية الكلية، وقد أكد الأسبوع الماضي مرة أخرى هذه الحقيقة الواضحة. حتى دون النظر
واصل زوج العملات GBP/USD التداول الجانبي يوم الجمعة، محافظًا على مستوياته القريبة من أعلى مستوياتها في ثلاث سنوات. إن رفض الجنيه الإسترليني حتى لتصحيح طفيف نحو الأسفل يظهر عدم تصديق
واصل زوج العملات EUR/USD التداول بشكل جانبي طوال يوم الجمعة. في النصف الثاني من الأسبوع الماضي، تداول اليورو حصريًا بين المستويات 1.1321 و1.1391، على الرغم من أن القناة الجانبية العامة
واصل زوج الجنيه الإسترليني/الدولار الأمريكي التداول في الاتجاه الصاعد يوم الخميس على الرغم من عدم وجود أسباب موضوعية لهذا التحرك. لم تكن هناك أحداث أو أخبار مهمة في المملكة المتحدة،
في يوم الخميس، استمر زوج العملات GBP/USD في التداول على "الطريقة الأوروبية". كانت التحركات داخل اليوم ضعيفة نسبيًا، وتشير الصورة الفنية إلى أن الاتجاه قد يتحول نحو الانخفاض. لقد استقرت
تداول زوج العملات EUR/USD بهدوء أكبر يوم الخميس مقارنة بالنصف الأول من الأسبوع، وكان السوق أيضًا أكثر تقنية نسبيًا. منذ بداية الأسبوع، كنا نكرر نفس الرسالة - تحركات السوق كانت
شارت الفوركس
على شبكة الانترنت

Your IP address shows that you are currently located in the USA. If you are a resident of the United States, you are prohibited from using the services of InstaFintech Group including online trading, online transfers, deposit/withdrawal of funds, etc.
If you think you are seeing this message by mistake and your location is not the US, kindly proceed to the website. Otherwise, you must leave the website in order to comply with government restrictions.
Why does your IP address show your location as the USA?
Please confirm whether you are a US resident or not by clicking the relevant button below. If you choose the wrong option, being a US resident, you will not be able to open an account with InstaTrade anyway.
We are sorry for any inconvenience caused by this message.


