আরও দেখুন


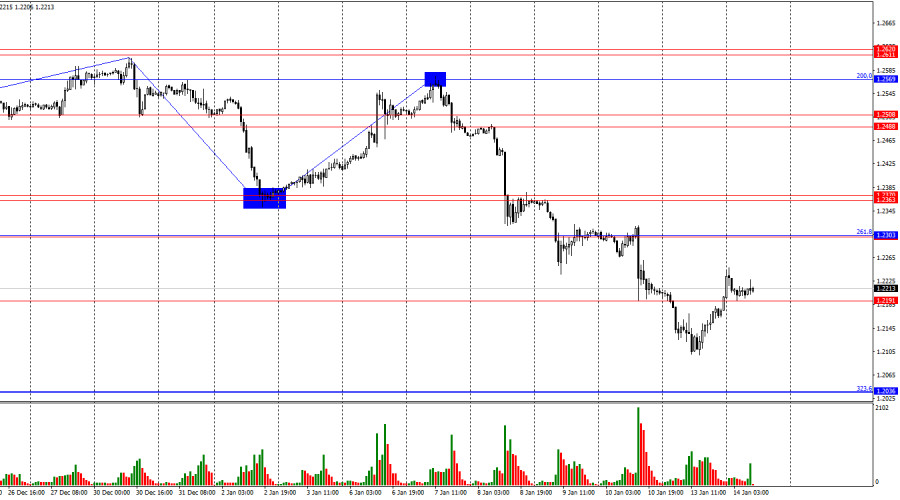
The wave structure raises no questions. The last completed upward wave did not break the previous wave's peak, while the current downward wave has broken the previous low. Thus, a "bearish" trend is clearly forming, with no signs of its conclusion. To end the trend, the pound would need to rise to at least the 1.2569 level and confidently close above it. Such a development seems unlikely in the near future.
On Monday, there was no significant news, and today traders are likely to focus only on the US Producer Price Index (PPI). However, the market is primarily awaiting tomorrow's inflation reports from both the UK and the US, which are the most critical releases of the week. These reports could either halt the dollar's growth or further fuel it.
Inflation dynamics are currently straightforward. US inflation is rising, as anticipated by traders and the Federal Reserve. The stronger the inflation increase for December, the higher the likelihood of renewed dollar growth, as the FOMC could reduce its planned monetary policy easing in 2025 to one or even zero rate cuts. Conversely, weaker-than-expected inflation could weaken the dollar. The same logic applies to UK inflation. These reports will be released six hours apart tomorrow, meaning the pair's movements may shift directions at different times. By the end of the day, we should have clarity on whether the dollar can continue its growth trajectory.
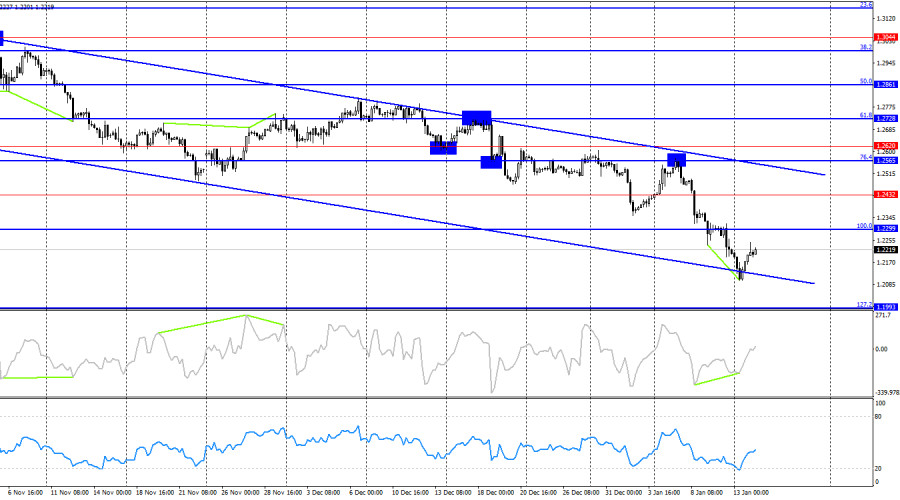
On the 4-hour chart, the pair rebounded from the 76.4% Fibonacci corrective level at 1.2565, consolidated below the 100.0% Fibonacci level at 1.2299, and continues its descent toward the 127.2% Fibonacci corrective level at 1.1993. The downward trend channel indicates bearish dominance, which they are unlikely to relinquish soon. Only a close above the channel would signal a potential strong recovery for the pound. A developing "bearish" divergence on the CCI indicator warns of a possible resumption of the decline.
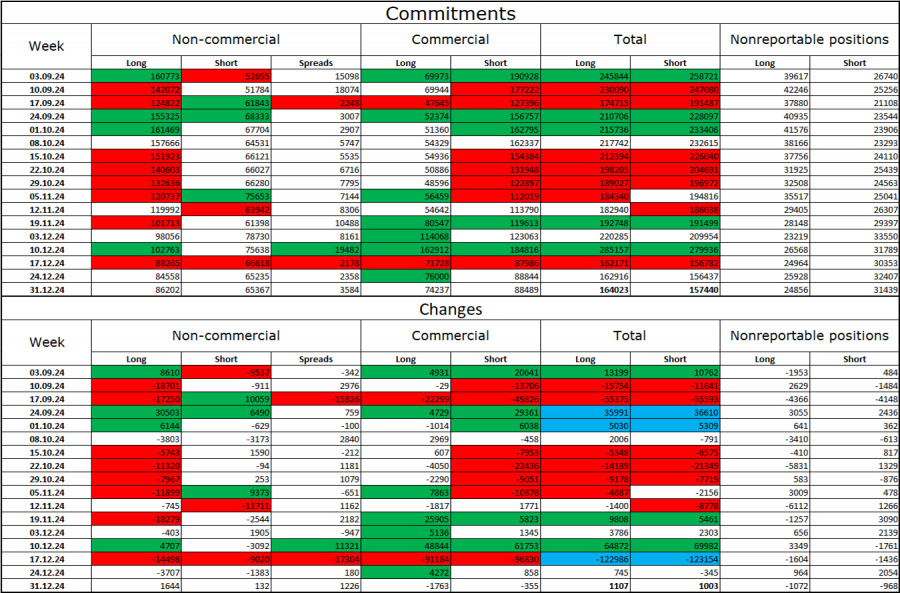
The sentiment of the "Non-commercial" category of traders showed little change in the latest reporting week. The number of long positions held by speculators increased by 1,644, while short positions grew by 132. Bulls still hold an advantage, but it is visibly shrinking. The gap between long and short positions is now only 21,000: 86,000 versus 65,000.
In my view, the pound retains downward potential, and COT reports indicate strengthening bearish positions almost every week. Over the past three months, the number of long positions has decreased from 160,000 to 86,000, while short positions have increased from 52,000 to 65,000. I believe professional players will continue reducing long positions or increasing shorts over time, as all possible factors supporting the pound have already played out. Technical analysis also supports the pound's decline.
Tuesday's economic calendar contains only one minor event. The impact of the information background on trader sentiment today will be minimal.
4-hour chart: Built between 1.2299 and 1.3432.
You have already liked this post today
*এখানে পোস্ট করা মার্কেট বিশ্লেষণ আপনার সচেতনতা বৃদ্ধির জন্য প্রদান করা হয়, ট্রেড করার নির্দেশনা প্রদানের জন্য প্রদান করা হয় না।


Your IP address shows that you are currently located in the USA. If you are a resident of the United States, you are prohibited from using the services of InstaFintech Group including online trading, online transfers, deposit/withdrawal of funds, etc.
If you think you are seeing this message by mistake and your location is not the US, kindly proceed to the website. Otherwise, you must leave the website in order to comply with government restrictions.
Why does your IP address show your location as the USA?
Please confirm whether you are a US resident or not by clicking the relevant button below. If you choose the wrong option, being a US resident, you will not be able to open an account with InstaTrade anyway.
We are sorry for any inconvenience caused by this message.


