অ্যাকচুয়াল প্যাটার্নস

প্যাটার্ন হলো গ্রাফিক্যাল মডেল, যা মূল্য ওঠানামার ভিত্তিতে চার্টে তৈরি হয়। টেকনিক্যাল বিশ্লেষণের নীতি অনুযায়ী, ইতিহাসের (প্রাইস মুভমেন্ট) পুনরাবৃত্তি ঘটে। অর্থাৎ, পরিস্থিতি যদি একই রকম থাকে তাহলে প্রাইস মুভমেন্টও প্রায় একই রকম হয়। এর ফলে মূল্যের ওঠানামা কেমন হবে তা আগেই থেকেই অনুমান করা যায়।
ইন্সটাফরেক্স এর প্রাসঙ্গিক প্যাটার্নসমূহ সহজেই ব্যবহার করা যায়, যার মাধ্যমে মার্কেটের সর্বশেষ পরিস্থিতি জানা যায় এবং তার উপর ভিত্তি করে সিদ্ধান্ত নেওয়া যায়। আমাদের সেবাগুলো থেকে আপনি যেকোনো পেয়ার এবং টাইমফ্রেমের জন্য সর্বশেষ এবং সবচেয়ে প্রাসঙ্গিক প্যাটার্নগুলো খুঁজে পাবেন।
Actual Patterns
- All
- All
- Bearish Rectangle
- Bearish Symmetrical Triangle
- Bearish Symmetrical Triangle
- Bullish Rectangle
- Double Top
- Double Top
- Triple Bottom
- Triple Bottom
- Triple Top
- Triple Top
- All
- All
- Buy
- Sale
- All
- 1
- 2
- 3
- 4
- 5
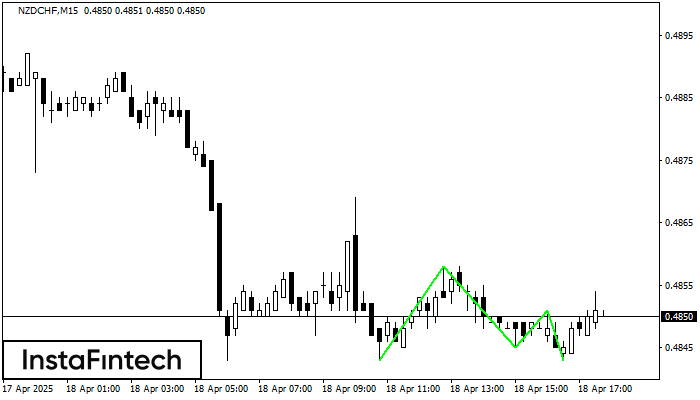
डबल बॉटम
was formed on 18.04 at 19:15:27 (UTC+0)
signal strength 2 of 5
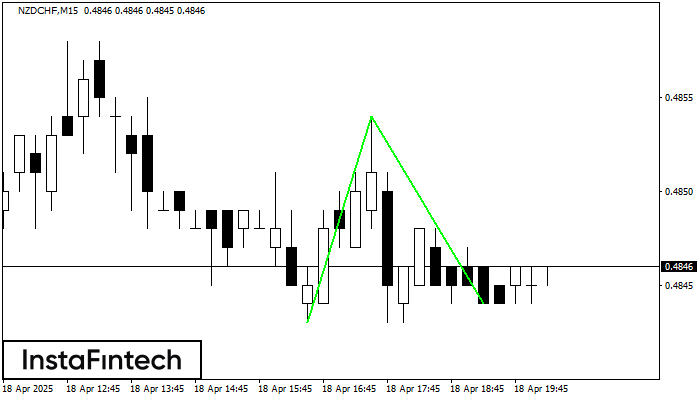
डबल बॉटम पैटर्न NZDCHF M15 पर बना है; ऊपरी सीमा 0.4854 है; निचली सीमा 0.4844 है। पैटर्न की चौड़ाई 11 अंक है। ऊपरी सीमा 0.4854 के टूटने के मामले में
M5 और M15 समय सीमा में अधिक फाल्स एंट्री पॉइंट्स हो सकते हैं।
Open chart in a new window
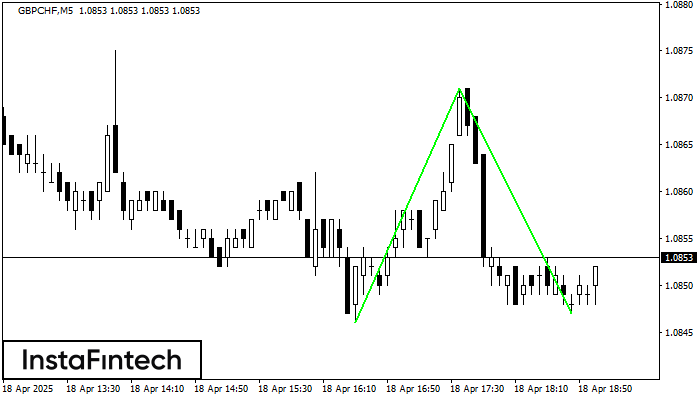
डबल बॉटम
was formed on 18.04 at 18:15:46 (UTC+0)
signal strength 2 of 5

डबल बॉटम पैटर्न GBPCHF M15 पर बना है। यह फॉर्मेशन नीचे से ऊपर की ओर प्रवृत्ति के उलट होने का संकेत देता है। संकेत यह है कि पैटर्न 1.0871 की
M5 और M15 समय सीमा में अधिक फाल्स एंट्री पॉइंट्स हो सकते हैं।
Open chart in a new window
हेड एण्ड शोल्डर्स
was formed on 18.04 at 18:05:18 (UTC+0)
signal strength 1 of 5

EURJPY M5 ने निम्न विशेषताओं के साथ हेड एण्ड शोल्डर्स पैटर्न का गठन किया: हेड का टॉप 162.14 पर है, नेकलाइन और ऊपर का कोण 161.98/161.96 पर है। इस पैटर्न
M5 और M15 समय सीमा में अधिक फाल्स एंट्री पॉइंट्स हो सकते हैं।
Open chart in a new window
डबल बॉटम
was formed on 18.04 at 18:05:13 (UTC+0)
signal strength 1 of 5
डबल बॉटम पैटर्न GBPCHF M5 पर बना है। यह फॉर्मेशन नीचे से ऊपर की ओर प्रवृत्ति के उलट होने का संकेत देता है। संकेत यह है कि पैटर्न 1.0871 की
M5 और M15 समय सीमा में अधिक फाल्स एंट्री पॉइंट्स हो सकते हैं।
Open chart in a new window
ट्रिपल टॉप
was formed on 18.04 at 18:00:33 (UTC+0)
signal strength 3 of 5
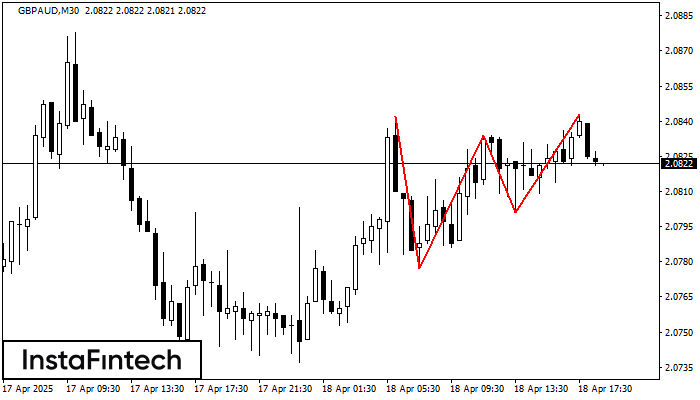
GBPAUD M30 के चार्ट पर ट्रिपल टॉप पैटर्न बना है। पैटर्न की विशेषताएं: सीमाओं में एक आरोही कोण मौजूद है; पैटर्न की निचली रेखा 2.0777/2.0801 पर है और ऊपरी सीमा
Open chart in a new window
डबल टॉप
was formed on 18.04 at 18:00:15 (UTC+0)
signal strength 4 of 5
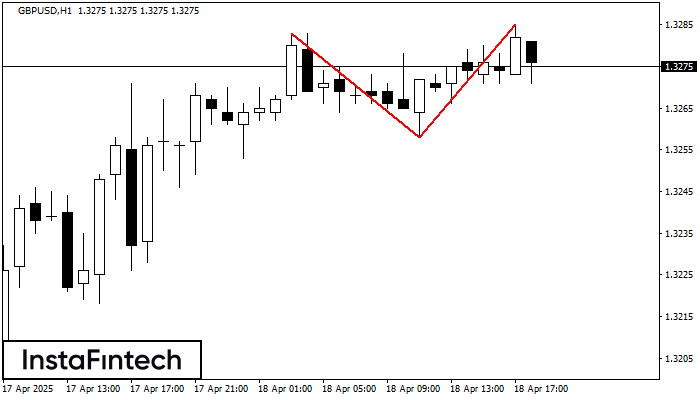
GBPUSD H1 के चार्ट पर डबल टॉप रीवर्सल पैटर्न बना है। विशेषताएं: ऊपरी सीमा 1.3285; निचली सीमा 1.3258; पैटर्न की चौड़ाई 27 पॉइंट्स। संकेत: निचली सीमा के टूटने से 1.3218
Open chart in a new window
ट्रिपल टॉप
was formed on 18.04 at 17:45:14 (UTC+0)
signal strength 2 of 5
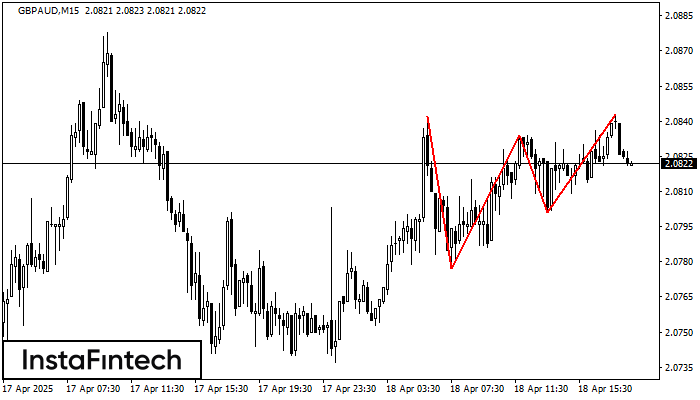
ट्रिपल टॉप पैटर्न GBPAUD M15 ट्रेडिंग इंस्ट्रूमेंट के चार्ट पर बना है। यह एक रीवर्सल पैटर्न है जिसमें निम्नलिखित विशेषताएं हैं: प्रतिरोध स्तर -1, समर्थन स्तर -24, और पैटर्न की
M5 और M15 समय सीमा में अधिक फाल्स एंट्री पॉइंट्स हो सकते हैं।
Open chart in a new window
ट्रिपल टॉप
was formed on 18.04 at 17:30:31 (UTC+0)
signal strength 3 of 5
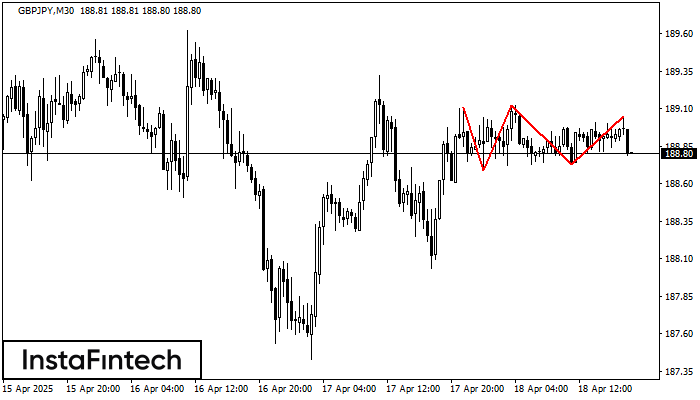
GBPJPY M30 ट्रेडिंग इंस्ट्रूमेंट के चार्ट पर, ट्रिपल टॉप पैटर्न जो एक प्रवृत्ति परिवर्तन का संकेत देता है, बना है। यह संभव है कि तीसरी चोटी के गठन के बाद
Open chart in a new window
ट्रिपल बॉटम
was formed on 18.04 at 16:45:15 (UTC+0)
signal strength 2 of 5
ट्रिपल बॉटम पैटर्न NZDCHF M15 ट्रेडिंग इंस्ट्रूमेंट के चार्ट पर बना है। 0.4858/0.4851 के टूटने की स्थिति में पैटर्न नीचे से ऊपर की ओर के ट्रेंड में बदलाव का संकेत
M5 और M15 समय सीमा में अधिक फाल्स एंट्री पॉइंट्स हो सकते हैं।
Open chart in a new window