অ্যাকচুয়াল প্যাটার্নস

প্যাটার্ন হলো গ্রাফিক্যাল মডেল, যা মূল্য ওঠানামার ভিত্তিতে চার্টে তৈরি হয়। টেকনিক্যাল বিশ্লেষণের নীতি অনুযায়ী, ইতিহাসের (প্রাইস মুভমেন্ট) পুনরাবৃত্তি ঘটে। অর্থাৎ, পরিস্থিতি যদি একই রকম থাকে তাহলে প্রাইস মুভমেন্টও প্রায় একই রকম হয়। এর ফলে মূল্যের ওঠানামা কেমন হবে তা আগেই থেকেই অনুমান করা যায়।
ইন্সটাফরেক্স এর প্রাসঙ্গিক প্যাটার্নসমূহ সহজেই ব্যবহার করা যায়, যার মাধ্যমে মার্কেটের সর্বশেষ পরিস্থিতি জানা যায় এবং তার উপর ভিত্তি করে সিদ্ধান্ত নেওয়া যায়। আমাদের সেবাগুলো থেকে আপনি যেকোনো পেয়ার এবং টাইমফ্রেমের জন্য সর্বশেষ এবং সবচেয়ে প্রাসঙ্গিক প্যাটার্নগুলো খুঁজে পাবেন।
Triple Bottom
was formed on 21.03 at 01:00:34 (UTC+0)
signal strength 2 of 5
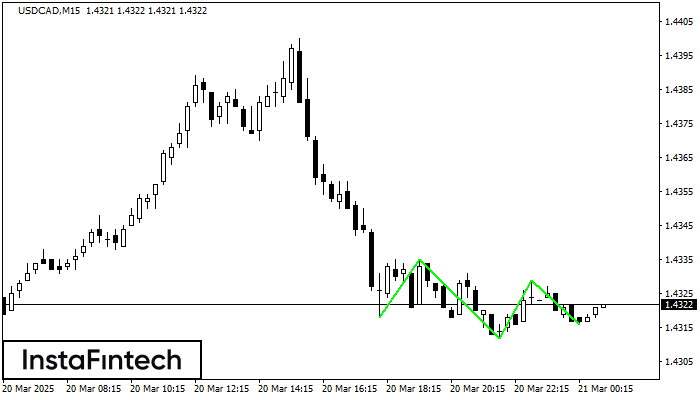
The Triple Bottom pattern has been formed on USDCAD M15. It has the following characteristics: resistance level 1.4335/1.4329; support level 1.4318/1.4316; the width is 17 points. In the event of a breakdown of the resistance level of 1.4335, the price is likely to continue an upward movement at least to 1.4334.
The M5 and M15 time frames may have more false entry points.
আরও দেখুন
- All
- All
- Bearish Rectangle
- Bearish Symmetrical Triangle
- Bearish Symmetrical Triangle
- Bullish Rectangle
- Double Top
- Double Top
- Triple Bottom
- Triple Bottom
- Triple Top
- Triple Top
- All
- All
- Buy
- Sale
- All
- 1
- 2
- 3
- 4
- 5
Double Bottom
was formed on 09.04 at 21:45:29 (UTC+0)
signal strength 1 of 5
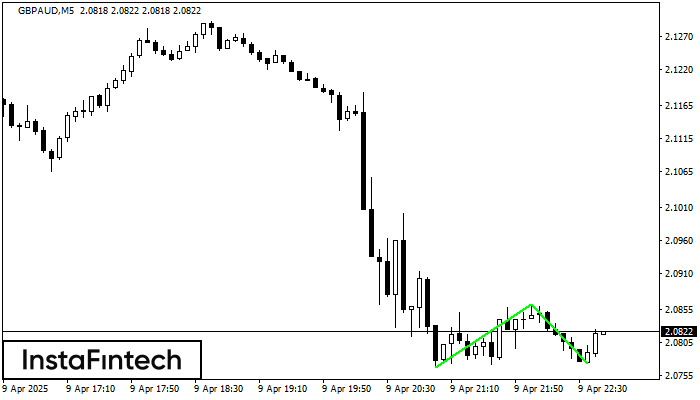
The Double Bottom pattern has been formed on GBPAUD M5. This formation signals a reversal of the trend from downwards to upwards. The signal is that a buy trade should
The M5 and M15 time frames may have more false entry points.
Open chart in a new window
Bullish Flag
was formed on 09.04 at 21:24:25 (UTC+0)
signal strength 2 of 5
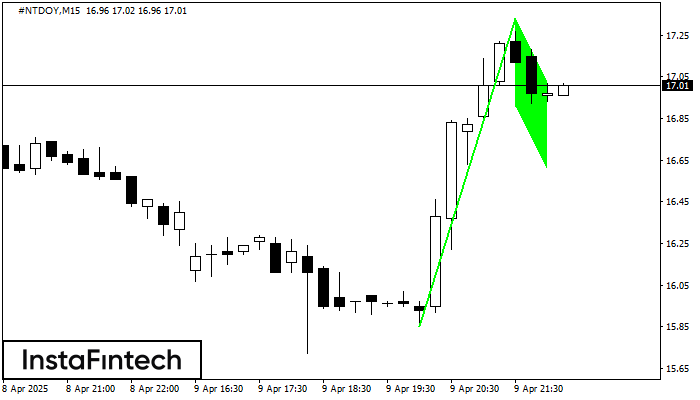
The Bullish Flag pattern has been formed on #NTDOY at M15. The lower boundary of the pattern is located at 16.91/16.61, while the higher boundary lies at 17.33/17.03. The projection
The M5 and M15 time frames may have more false entry points.
Open chart in a new window
Bullish Flag
was formed on 09.04 at 21:24:22 (UTC+0)
signal strength 2 of 5

The Bullish Flag pattern has been formed on the chart #NTDOY M15 which signals that the upward trend will continue. Signals: а break of the peak at 17.33 may push
The M5 and M15 time frames may have more false entry points.
Open chart in a new window