অ্যাকচুয়াল প্যাটার্নস

প্যাটার্ন হলো গ্রাফিক্যাল মডেল, যা মূল্য ওঠানামার ভিত্তিতে চার্টে তৈরি হয়। টেকনিক্যাল বিশ্লেষণের নীতি অনুযায়ী, ইতিহাসের (প্রাইস মুভমেন্ট) পুনরাবৃত্তি ঘটে। অর্থাৎ, পরিস্থিতি যদি একই রকম থাকে তাহলে প্রাইস মুভমেন্টও প্রায় একই রকম হয়। এর ফলে মূল্যের ওঠানামা কেমন হবে তা আগেই থেকেই অনুমান করা যায়।
ইন্সটাফরেক্স এর প্রাসঙ্গিক প্যাটার্নসমূহ সহজেই ব্যবহার করা যায়, যার মাধ্যমে মার্কেটের সর্বশেষ পরিস্থিতি জানা যায় এবং তার উপর ভিত্তি করে সিদ্ধান্ত নেওয়া যায়। আমাদের সেবাগুলো থেকে আপনি যেকোনো পেয়ার এবং টাইমফ্রেমের জন্য সর্বশেষ এবং সবচেয়ে প্রাসঙ্গিক প্যাটার্নগুলো খুঁজে পাবেন।
Head and Shoulders
was formed on 02.04 at 19:00:24 (UTC+0)
signal strength 3 of 5
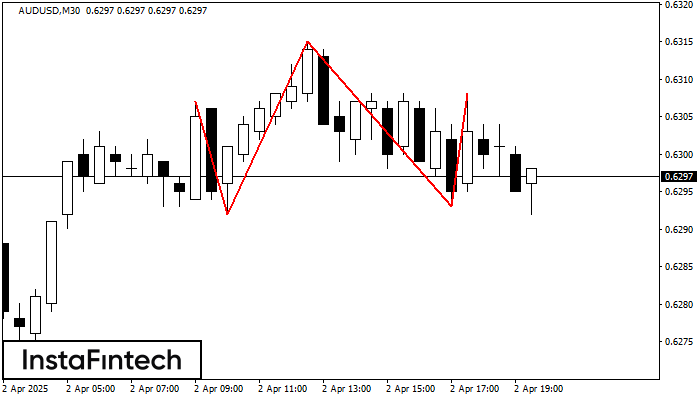
The AUDUSD M30 formed the Head and Shoulders pattern with the following features: The Head’s top is at 0.6315, the Neckline and the upward angle are at 0.6292/0.6293. The formation of this pattern can bring about changes in the current trend from bullish to bearish. In case the pattern triggers the expected changes, the price of AUDUSD will go towards 0.6263.
- All
- All
- Bearish Rectangle
- Bearish Symmetrical Triangle
- Bearish Symmetrical Triangle
- Bullish Rectangle
- Double Top
- Double Top
- Triple Bottom
- Triple Bottom
- Triple Top
- Triple Top
- All
- All
- Buy
- Sale
- All
- 1
- 2
- 3
- 4
- 5
Inverse Head and Shoulder
was formed on 22.04 at 00:00:27 (UTC+0)
signal strength 1 of 5

According to the chart of M5, AUDUSD produced the pattern termed the Inverse Head and Shoulder. The Head is fixed at 0.6402 while the median line of the Neck
The M5 and M15 time frames may have more false entry points.
Open chart in a new window
Bearish Symmetrical Triangle
was formed on 21.04 at 23:42:32 (UTC+0)
signal strength 3 of 5

According to the chart of M30, NZDJPY formed the Bearish Symmetrical Triangle pattern. Description: The lower border is 83.98/84.43 and upper border is 84.90/84.43. The pattern width is measured
Open chart in a new window
Double Top
was formed on 21.04 at 22:55:31 (UTC+0)
signal strength 1 of 5
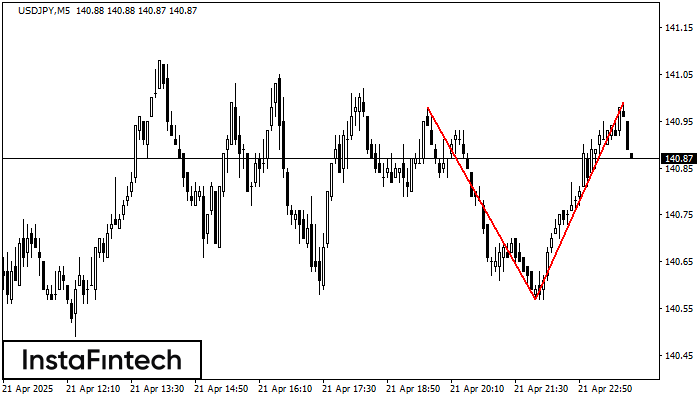
The Double Top reversal pattern has been formed on USDJPY M5. Characteristics: the upper boundary 140.98; the lower boundary 140.57; the width of the pattern is 42 points. Sell trades
The M5 and M15 time frames may have more false entry points.
Open chart in a new window