See also


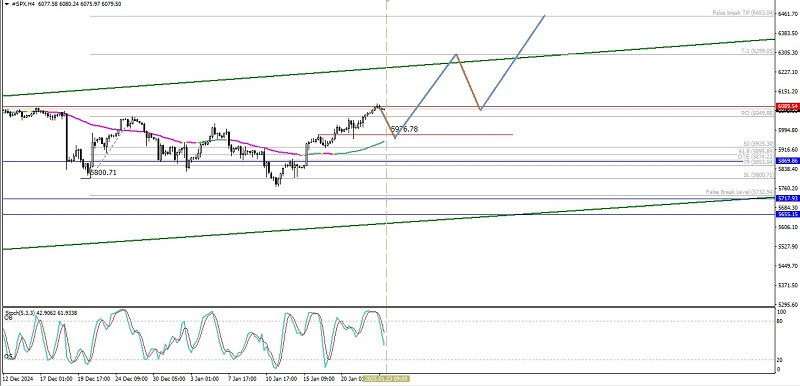
Although the price movement of the S&P 500 index is above the SMA (200) which has a slope that slopes upwards which indicates that buyers are still dominant on the 4-hour chart, the condition of the Stochastic Oscillator Crossing Sell indicator gives an indication of the potential for a weakening correction in the near future where 5976.78 will be tested if this level can act as a fairly strong support then #SPX has the potential to continue its strengthening back to the level of 6299.05 as its main target and if the momentum and volatility support then 6453.04 will be the next target but on the other hand if it turns out that the support level of 5976.78 is not strong enough to withstand the rate of weakening correction that will occur even if it breaks through and closes below the level of 5853.04 then the strengthening scenario that has been described previously will be invalid.
(Disclaimer)
You have already liked this post today
*The market analysis posted here is meant to increase your awareness, but not to give instructions to make a trade.


