See also


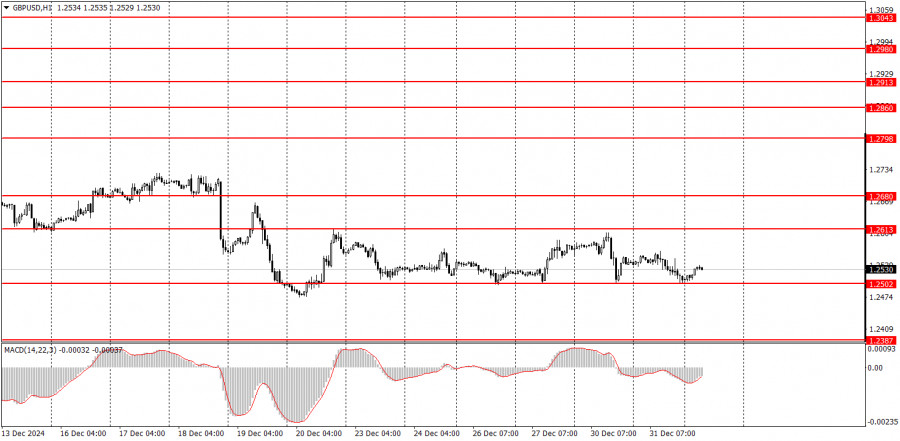
On Tuesday, the GBP/USD pair continued to trade within a horizontal channel, ranging between 1.2502 and 1.2613, thus extending the "New Year flat" phase. Similar to the EUR/USD pair, the price tested the 1.2502 level, which serves as the lower boundary of this channel. As a result, a rebound from this level, followed by a rise in the British pound towards 1.2613, is possible, as the flat phase has not yet concluded. Currently, there are no significant fundamental or macroeconomic factors at play, and the market may take another week or two to fully settle down after the New Year and Christmas holidays. It is still premature to assume that the holiday period has ended and that the pair will quickly enter a trend movement.
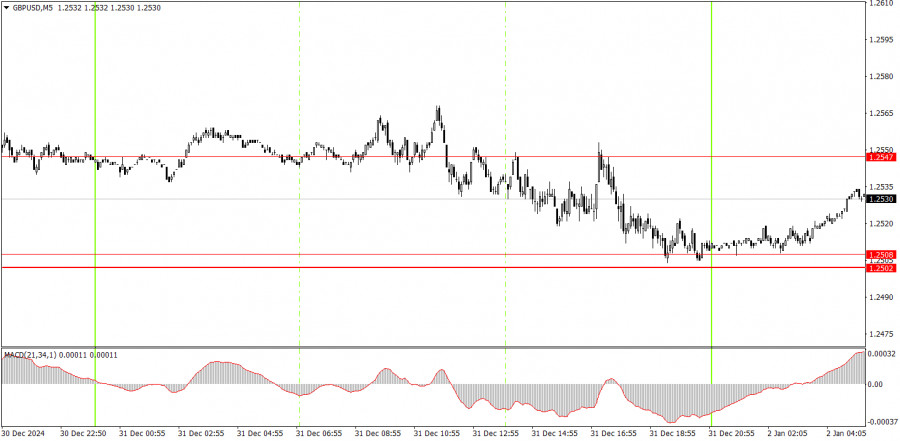
Looking at the 5-minute chart for GBP/USD, Tuesday's trading was quite erratic. The 1.2547 level was largely disregarded throughout the day. In a flat market, it is more important to focus on the upper and lower boundaries of the channel rather than on intermediate levels. Ultimately, the price did bounce from 1.2547 and fell to the lower boundary of the channel. However, making a profit from this signal was difficult due to the presence of several false signals forming near the same level. Clearly, December 31 is not an ideal day for trading.
In the hourly timeframe, the GBP/USD pair has completed its primary upward corrective phase and is currently in a consolidation phase. From a medium-term perspective, we fully anticipate a decline in the pound, as this appears to be the most logical outcome. However, it's important to note that the pound sterling demonstrates significant resistance against the US dollar. Therefore, while a decline is expected, traders should base their decisions on technical indicators. The outcomes of the Bank of England and Federal Reserve meetings fully support further downward movement.
On Thursday, the GBP/USD pair is likely to continue trading within the horizontal channel of 1.2502 to 1.2613. There will be limited news today, and expecting an immediate price drop on the first working day of the new year would be overly optimistic. Nonetheless, it is essential to closely monitor price behavior near the lower boundary of this range.
On the 5-minute timeframe, trading opportunities can be found at the following levels: 1.2387, 1.2445, 1.2502–1.2508, 1.2547, 1.2633, 1.2680–1.2685, 1.2723, 1.2791–1.2798, 1.2848–1.2860, 1.2913, and 1.2980–1.2993. Additionally, on Thursday, the second estimates for December manufacturing activity reports will be released for both the UK and the US. We believe these reports are unlikely to cause any significant market reaction unless there are substantial deviations from the initial estimates.
Support and Resistance Levels: These are target levels for opening or closing positions and can also serve as points for placing Take Profit orders.
Red Lines: Channels or trendlines indicating the current trend and the preferred direction for trading.
MACD Indicator (14,22,3): A histogram and signal line used as a supplementary source of trading signals.
Important Events and Reports: Found in the economic calendar, these can heavily influence price movements. Exercise caution or exit the market during their release to avoid sharp reversals.
Forex trading beginners should remember that not every trade will be profitable. Developing a clear strategy and practicing proper money management are essential for long-term trading success.
You have already liked this post today
*The market analysis posted here is meant to increase your awareness, but not to give instructions to make a trade.


 Our new app for your convenient and fast verification

Your IP address shows that you are currently located in the USA. If you are a resident of the United States, you are prohibited from using the services of InstaFintech Group including online trading, online transfers, deposit/withdrawal of funds, etc.
If you think you are seeing this message by mistake and your location is not the US, kindly proceed to the website. Otherwise, you must leave the website in order to comply with government restrictions.
Why does your IP address show your location as the USA?
Please confirm whether you are a US resident or not by clicking the relevant button below. If you choose the wrong option, being a US resident, you will not be able to open an account with InstaTrade anyway.
We are sorry for any inconvenience caused by this message.


