Voir aussi


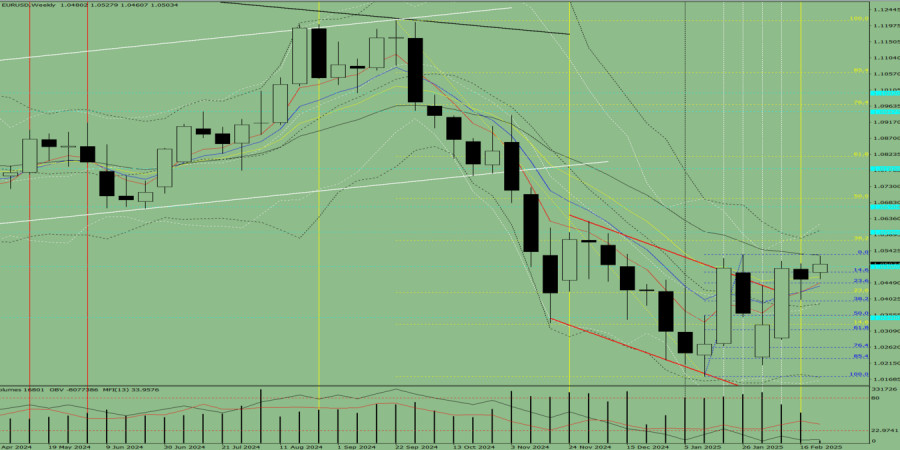
Analyse des tendances (Fig. 1)Cette semaine, le marché pourrait s'élever de 1.0459 (prix de clôture de la semaine dernière) vers 1.0573, ce qui représente le niveau de retracement de 38,2 % (ligne pointillée jaune). Si ce niveau est testé, le prix pourrait continuer son mouvement à la hausse vers 1.0597, un niveau de résistance historique (ligne pointillée bleue).
Analyse Complète
Basé sur une analyse complète, on s'attend à ce que la paire EUR/USD maintienne une trajectoire ascendante tout au long de la semaine. La bougie hebdomadaire projetée est susceptible de se former sans ombre inférieure (indiquant un mouvement haussier le lundi) mais pourrait développer une ombre supérieure d'ici vendredi, signalant un possible repli.
Scénario Alternatif
Si la paire monte de 1.0459 à 1.0532 (fractal supérieur, ligne pointillée bleue), elle pourrait ensuite inverser à la baisse vers 1.0480, ce qui correspond au niveau de retracement de Fibonacci de 14.6% (ligne pointillée bleue).
You have already liked this post today
*The market analysis posted here is meant to increase your awareness, but not to give instructions to make a trade.


Graphiques Forex
Version Web

Your IP address shows that you are currently located in the USA. If you are a resident of the United States, you are prohibited from using the services of InstaFintech Group including online trading, online transfers, deposit/withdrawal of funds, etc.
If you think you are seeing this message by mistake and your location is not the US, kindly proceed to the website. Otherwise, you must leave the website in order to comply with government restrictions.
Why does your IP address show your location as the USA?
Please confirm whether you are a US resident or not by clicking the relevant button below. If you choose the wrong option, being a US resident, you will not be able to open an account with InstaTrade anyway.
We are sorry for any inconvenience caused by this message.

