Lihat juga


 27.11.2023 11:31 PM
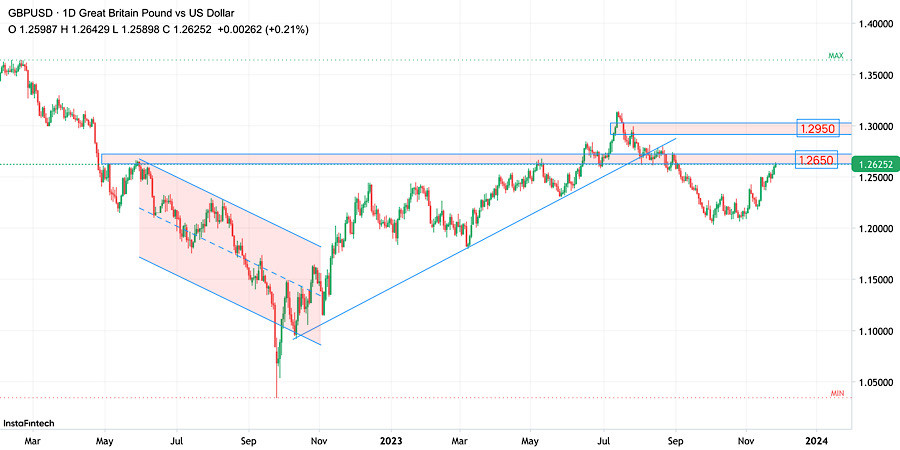
The GBP/USD pair faced a strong resistance near 1.3200 and started a fresh downtrend.
It broke the 1.2800 then 1.2600 support levels on a H4 candlestick and extended its decline towards 1.2500 where the pair showed some indecision in a tight range before resuming its bearish trend.
The next target for the bears was located around 1.2150, where another zone of indecision has been established.
A break below 1.2100 level could open the doors for more losses towards 1.1850. However, significant bullish recovery has been expressed upon the repeated visits that occurred during this month.
On the other hand, the current bullish recovery is being challenged around 1.2650 where a previous consolidation range was established.
That's why, Price action should be watched cautiously for determining the next destination for the pair.
You have already liked this post today
*Analisis pasar yang diposting disini dimaksudkan untuk meningkatkan pengetahuan Anda namun tidak untuk memberi instruksi trading.
Pada chart 4 jamnya instrumen komoditi Minyak Mentah nampak terlihat bergerak dibawah WMA (21) yang juga memiliki kemiringan slope yang menurun dimana ini berarti saat ini Seller tengah mendominasi
Bila Kita perhatikan chart 4 jam pasangan mata uang silang GBP/JPY nampak terlihat dua hal yang menarik pertama munculnya pola Rising Wedge, kedua terdapat Divergent antara pergerakan harga GBP/JPY dengan
Di sisi lain, jika tekanan bearish mendominasi dan euro terkonsolidasi di bawah 1.1370, ini dapat dianggap sebagai sinyal jual dengan target di 6/8 Murray yang terletak di 1.1230 dan akhirnya
Pada sesi Amerika awal, emas diperdagangkan di sekitar 3.299 dalam channel tren menurun yang terbentuk sejak 21 April, menunjukkan pemulihan di atas support pada 3.270. Pada grafik H4, kita dapat
Di chart hariannya meski pergerakan harga EUR/USD masih berada diatas EMA (21) namun dengan kemunculan Divergence antara pergerakan harga Fiber dengan indikator Stochastic Oscillator telah memberi petunjuk kalau dalam waktu
Dari apa yang terlihat di chart hariannya instrumen komoditi Platinum terlihat masih bergerak dalam kondisi yang Sideways dimana hal ini terlihat dari EMA (34) yang bergerak melalui badan-badan Candlestick ditambah
Minggu lalu, pasar memperbarui posisi terendah, tetapi bear gagal melanjutkan pergerakan turun sepenuhnya. Hal ini mungkin disebabkan oleh posisi terendah minggu sebelumnya (141,63) yang diperkuat oleh level support bulanan (141,96)
Pada awal sesi Amerika, emas trading sekitar 3,276 dengan tekanan bearish setelah menemukan resistensi kuat di sekitar 3,270, level yang bertepatan dengan retracement Fibonacci 38,2%. Emas sekarang mungkin mencapai level
Pada sesi Amerika awal, pasangan EUR/USD diperdagangkan di sekitar 1,1358 dalam saluran tren turun yang terbentuk pada 18 April. Pasangan ini berada di bawah tekanan bearish. Kami percaya instrumen
Your IP address shows that you are currently located in the USA. If you are a resident of the United States, you are prohibited from using the services of InstaFintech Group including online trading, online transfers, deposit/withdrawal of funds, etc.
If you think you are seeing this message by mistake and your location is not the US, kindly proceed to the website. Otherwise, you must leave the website in order to comply with government restrictions.
Why does your IP address show your location as the USA?
Please confirm whether you are a US resident or not by clicking the relevant button below. If you choose the wrong option, being a US resident, you will not be able to open an account with InstaTrade anyway.
We are sorry for any inconvenience caused by this message.

