Lihat juga


 28.03.2025 05:01 AM
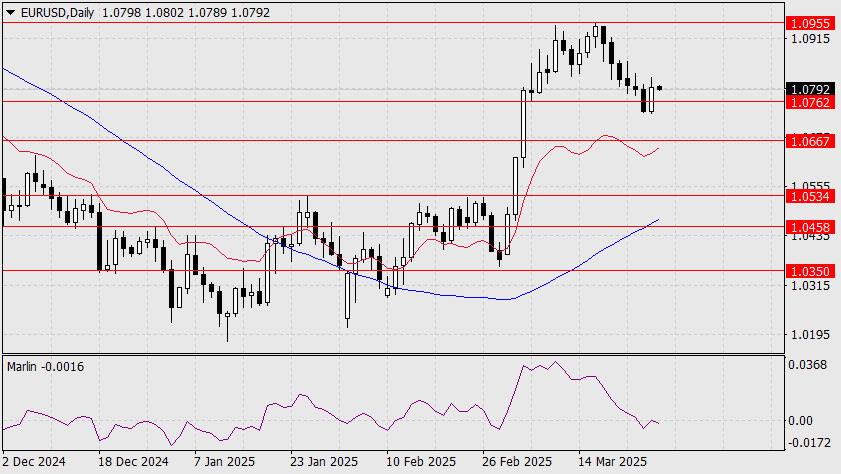
The key economic report yesterday—U.S. Q4 GDP—came in at 2.4% versus 2.3% expected. However, three major agencies—Moody's, Fitch Ratings, and S&P Global—warned of a potential downturn due to restrictive tariffs, and the Congressional Budget Office lowered its growth forecast for the current year to 1.9% while also predicting inflation stabilization. As a result, the euro rose by 60 pips, reclaiming the technical level of 1.0762. This confirms that the dip below support on March 26 was false and indicates a more serious reversal than what we saw 2–3 days ago.
There is one caveat—the Marlin oscillator's signal line on the daily timeframe has not yet returned to positive territory after exiting it on Wednesday. Marlin will reenter the growth zone once the price surpasses yesterday's high at 1.0822. That would be a signal for a move toward the 1.0955 target. A breakout above this resistance would open the path toward 1.1027.
However, if the price drops below yesterday's low of 1.0733, it may not stop at the first support at 1.0667, as the market is teetering between two fundamental narratives: the brewing crisis and capital flight into safety with potential Treasury QE support and the re-emergence of risk appetite over the next quarter.
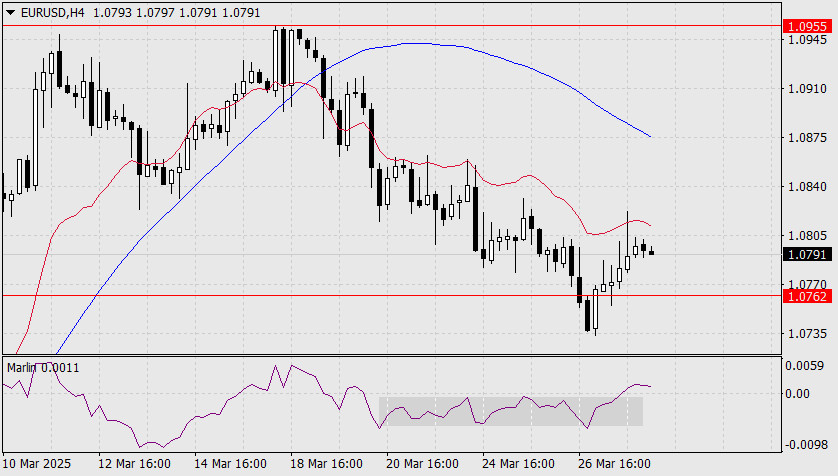
On the H4 chart, the Marlin oscillator's signal line sharply reversed from the lower boundary of its range and is now in bullish territory. The balance indicator line halted yesterday's price surge. A move above yesterday's high could also push the price above this balance line. The primary scenario remains bullish.
You have already liked this post today
*Analisis pasar yang diposting disini dimaksudkan untuk meningkatkan pengetahuan Anda namun tidak untuk memberi instruksi trading.
Pada awal sesi Amerika, emas trading sekitar 3,312 dengan bias bullish setelah menembus segitiga simetris. Emas kemungkinan akan terus naik dalam beberapa jam ke depan, mencapai level 7/8 Murray
Dengan kondisi Stochastic Oscillator yang tengah menuju ke level Oversold (20) pada chart 4 jam dari pasangan mata uang silang AUD/JPY, maka dalam waktu dekat ini AUD/JPY berpotensi untuk melemah
Pada chart 4 jamnya, pasangan mata uang komoditi USD/CAD nampak terlihat bergerak dibawah EMA (100) serta munculnya pola Bearish 123 serta posisi indikator Stochastic Oscillator yang sudah berada diatas level
Pada awal sesi Amerika, emas diperdagangkan sekitar 3.220, menunjukkan tanda-tanda kelelahan. Koreksi teknis lebih lanjut menuju 21SMA kemungkinan akan terjadi dalam beberapa jam ke depan. Pada grafik H4, kita dapat
Dengan munculnya Divergence antara pergerakan harga pasangan mata uang silang EUR/JPY dengan indikator Stochastic Oscillator juga diikuti oleh hadirnya pola Bullish 123 yang diikuti oleh Bullish Ross Hook (RH)
 InstaFutures
Make money with a new promising instrument!
InstaTrade dalam angka

Your IP address shows that you are currently located in the USA. If you are a resident of the United States, you are prohibited from using the services of InstaFintech Group including online trading, online transfers, deposit/withdrawal of funds, etc.
If you think you are seeing this message by mistake and your location is not the US, kindly proceed to the website. Otherwise, you must leave the website in order to comply with government restrictions.
Why does your IP address show your location as the USA?
Please confirm whether you are a US resident or not by clicking the relevant button below. If you choose the wrong option, being a US resident, you will not be able to open an account with InstaTrade anyway.
We are sorry for any inconvenience caused by this message.


