Pola sebenarnya

Head and Shoulders
was formed on 02.04 at 19:00:24 (UTC+0)
signal strength 3 of 5
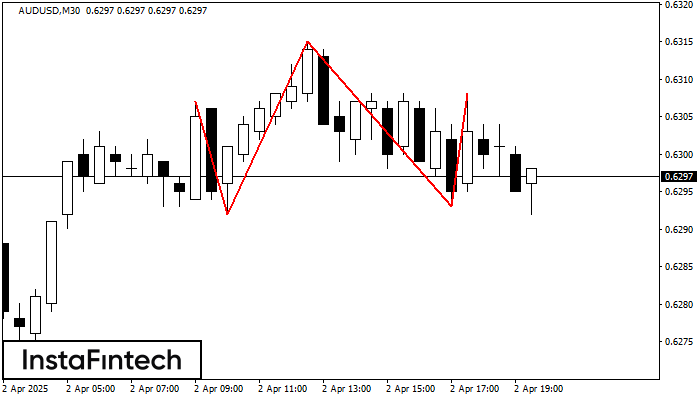
The AUDUSD M30 formed the Head and Shoulders pattern with the following features: The Head’s top is at 0.6315, the Neckline and the upward angle are at 0.6292/0.6293. The formation of this pattern can bring about changes in the current trend from bullish to bearish. In case the pattern triggers the expected changes, the price of AUDUSD will go towards 0.6263.
- All
- All
- Bearish Rectangle
- Bearish Symmetrical Triangle
- Bearish Symmetrical Triangle
- Bullish Rectangle
- Double Top
- Double Top
- Triple Bottom
- Triple Bottom
- Triple Top
- Triple Top
- All
- All
- Buy
- Sale
- All
- 1
- 2
- 3
- 4
- 5
Bawah Triple
was formed on 21.04 at 22:01:24 (UTC+0)
signal strength 3 of 5

Pola Bawah Triple telah terbentuk pada grafik instrumen trading USDJPY M30. Pola tersebut menandakan perubahan dalam trend dari menurun menjadi naik jika terjadi pemecahan (breakdown) 141.08/141.05
Open chart in a new window
Bawah Ganda
was formed on 21.04 at 22:00:49 (UTC+0)
signal strength 4 of 5

Pola Bawah Ganda telah terbentuk pada AUDCHF H1; batas atas di 0.5198; batas bawah di 0.5165. Lebar pola sebesar 34 poin. Jika harga menembus batas atas 0.5198, Perubahan dalam tren
Open chart in a new window
Segitiga Simetris Bearish
was formed on 21.04 at 21:58:31 (UTC+0)
signal strength 1 of 5
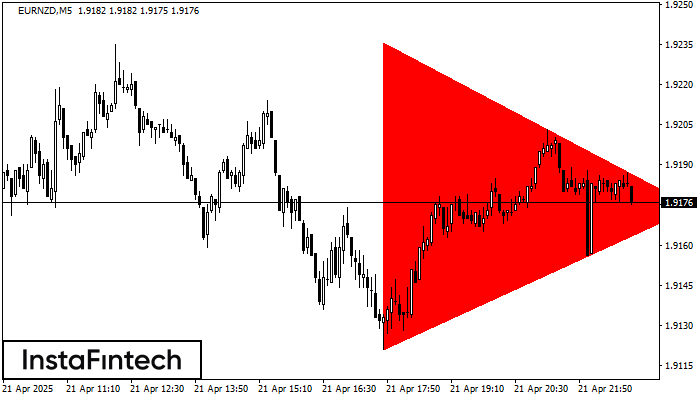
Menurut Grafik dari M5, EURNZD dibentuk pola Segitiga Simetris Bearish. Deskripsi: Batas yang lebih rendah adalah 1.9121/1.9174 dan batas atas adalah 1.9236/1.9174. Lebar pola diukur dalam grafik di -115 pips
Rangka waktu M5 dan M15 mungkin memiliki lebih dari titik entri yang keliru.
Open chart in a new window