Pola sebenarnya

Double Top
was formed on 02.04 at 19:45:19 (UTC+0)
signal strength 1 of 5
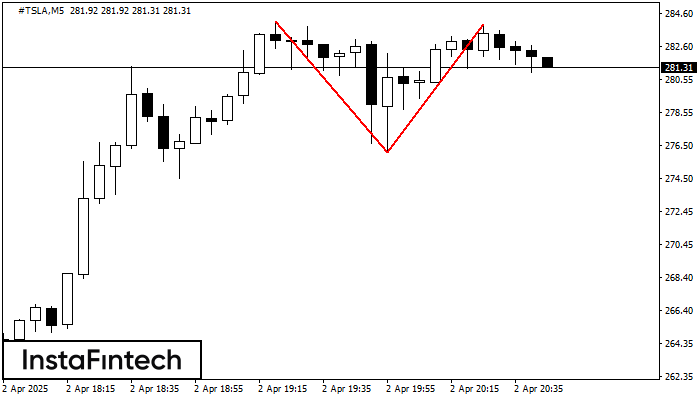
The Double Top pattern has been formed on #TSLA M5. It signals that the trend has been changed from upwards to downwards. Probably, if the base of the pattern 276.07 is broken, the downward movement will continue.
The M5 and M15 time frames may have more false entry points.
- All
- All
- Bearish Rectangle
- Bearish Symmetrical Triangle
- Bearish Symmetrical Triangle
- Bullish Rectangle
- Double Top
- Double Top
- Triple Bottom
- Triple Bottom
- Triple Top
- Triple Top
- All
- All
- Buy
- Sale
- All
- 1
- 2
- 3
- 4
- 5
Double Top
was formed on 21.04 at 22:26:30 (UTC+0)
signal strength 1 of 5

The Double Top reversal pattern has been formed on AUDCAD M5. Characteristics: the upper boundary 0.8880; the lower boundary 0.8869; the width of the pattern is 11 points. Sell trades
The M5 and M15 time frames may have more false entry points.
Open chart in a new window
Triple Bottom
was formed on 21.04 at 22:01:24 (UTC+0)
signal strength 3 of 5

The Triple Bottom pattern has formed on the chart of the USDJPY M30 trading instrument. The pattern signals a change in the trend from downwards to upwards in the case
Open chart in a new window
Double Bottom
was formed on 21.04 at 22:00:49 (UTC+0)
signal strength 4 of 5

The Double Bottom pattern has been formed on AUDCHF H1; the upper boundary is 0.5198; the lower boundary is 0.5165. The width of the pattern is 34 points. In case
Open chart in a new window