Pola sebenarnya

Bullish Symmetrical Triangle
was formed on 05.04 at 06:31:21 (UTC+0)
signal strength 2 of 5

According to the chart of M15, #Bitcoin formed the Bullish Symmetrical Triangle pattern. The lower border of the pattern touches the coordinates 83167.44/83888.94 whereas the upper border goes across 84422.11/83888.94. If the Bullish Symmetrical Triangle pattern is in progress, this evidently signals a further upward trend. In other words, in case the scenario comes true, the price of #Bitcoin will breach the upper border to head for 83889.16.
The M5 and M15 time frames may have more false entry points.
Lihat juga
- All
- All
- Bearish Rectangle
- Bearish Symmetrical Triangle
- Bearish Symmetrical Triangle
- Bullish Rectangle
- Double Top
- Double Top
- Triple Bottom
- Triple Bottom
- Triple Top
- Triple Top
- All
- All
- Buy
- Sale
- All
- 1
- 2
- 3
- 4
- 5
Inverse Head and Shoulder
was formed on 09.04 at 19:22:50 (UTC+0)
signal strength 1 of 5
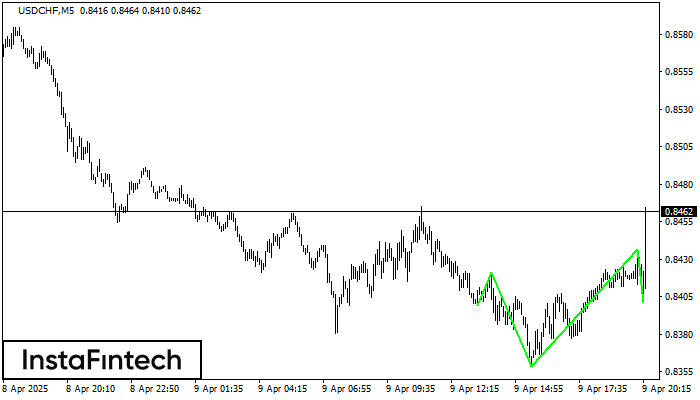
According to the chart of M5, USDCHF formed the Inverse Head and Shoulder pattern. The Head’s top is set at 0.8436 while the median line of the Neck is found
The M5 and M15 time frames may have more false entry points.
Open chart in a new window
Bullish Rectangle
was formed on 09.04 at 18:50:18 (UTC+0)
signal strength 1 of 5
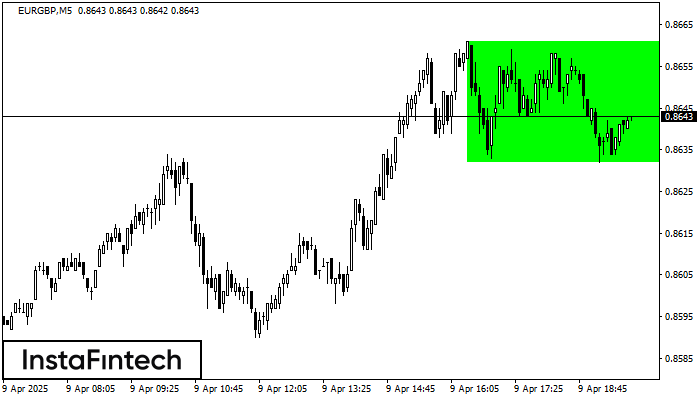
According to the chart of M5, EURGBP formed the Bullish Rectangle which is a pattern of a trend continuation. The pattern is contained within the following borders: the lower border
The M5 and M15 time frames may have more false entry points.
Open chart in a new window
Bearish Rectangle
was formed on 09.04 at 18:48:14 (UTC+0)
signal strength 2 of 5
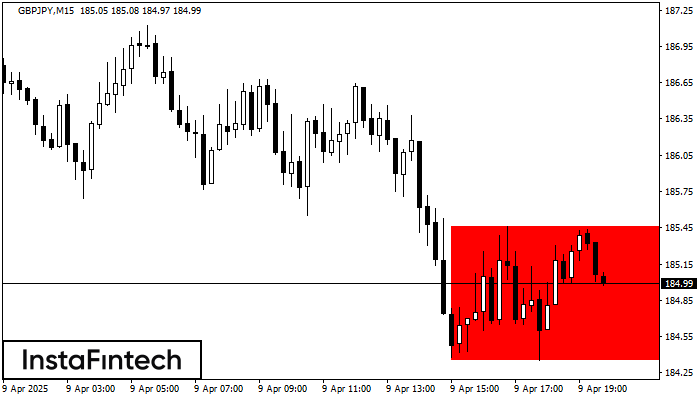
According to the chart of M15, GBPJPY formed the Bearish Rectangle. This type of a pattern indicates a trend continuation. It consists of two levels: resistance 185.46 - 0.00
The M5 and M15 time frames may have more false entry points.
Open chart in a new window