वास्तविक पैटर्न

पैटर्न ग्राफिकल मॉडल हैं जो चार्ट में मूल्य से बने होते हैं। तकनीकी विश्लेषण भविष्यवाणियों में से एक के अनुसार, इतिहास का मतलब मूल्य आंदोलन खुद को दोहराता है। इसका मतलब है कि मूल्य आंदोलन अक्सर एक ही परिस्थितियों में समान होते हैं जो उच्च संभावना के साथ स्थिति के आगे के विकास की भविष्यवाणी करना संभव बनाता है।
इंस्टा फॉरेक्स द्वारा प्रासंगिक पैटर्न एक उपयोग में आसान सेवा है जो आपको बाजार में नवीनतम परिवर्तनों के बारे में जागरूक होने और समय पर बाजार से संकेतों पर प्रतिक्रिया करने की अनुमति देती है। हमारी सेवा में आप हमेशा किसी भी जोड़ी और किसी भी समय सीमा पर नवीनतम और सबसे प्रासंगिक पैटर्न प्राप्त कर सकते हैं.
Double Top
was formed on 15.04 at 08:30:13 (UTC+0)
signal strength 3 of 5
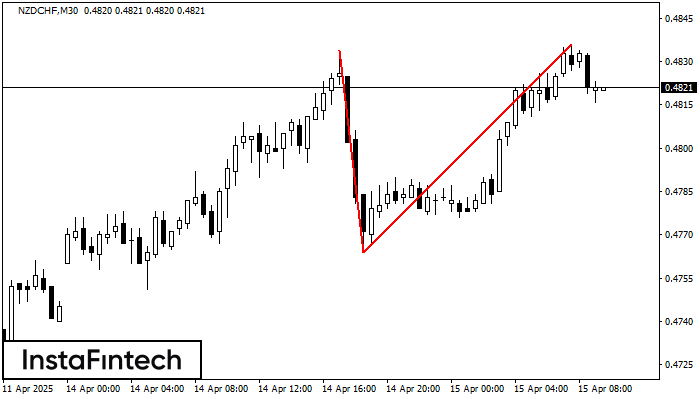
On the chart of NZDCHF M30 the Double Top reversal pattern has been formed. Characteristics: the upper boundary 0.4836; the lower boundary 0.4764; the width of the pattern 72 points. The signal: a break of the lower boundary will cause continuation of the downward trend targeting the 0.4734 level.
- All
- All
- Bearish Rectangle
- Bearish Symmetrical Triangle
- Bearish Symmetrical Triangle
- Bullish Rectangle
- Double Top
- Double Top
- Triple Bottom
- Triple Bottom
- Triple Top
- Triple Top
- All
- All
- Buy
- Sale
- All
- 1
- 2
- 3
- 4
- 5
डबल बॉटम
was formed on 21.04 at 10:30:12 (UTC+0)
signal strength 2 of 5

डबल बॉटम पैटर्न USDCAD M15 पर बना है; ऊपरी सीमा 1.3801 है; निचली सीमा 1.3791 है। पैटर्न की चौड़ाई 11 अंक है। ऊपरी सीमा 1.3801 के टूटने के मामले में
M5 और M15 समय सीमा में अधिक फाल्स एंट्री पॉइंट्स हो सकते हैं।
Open chart in a new window
बुलिश पताका
was formed on 21.04 at 10:10:25 (UTC+0)
signal strength 1 of 5

बुलिश पताका सिग्नल - ट्रेडिंग इंस्ट्रूमेंट NZDCAD M5, निरंतरता पैटर्न। पूर्वानुमान: पैटर्न के उच्च 0.8304 के ऊपर एक खरीद स्थिति सेट करना संभव है, इसके साथ अगला कदम फ्लैगपोल ऊंचाई
M5 और M15 समय सीमा में अधिक फाल्स एंट्री पॉइंट्स हो सकते हैं।
Open chart in a new window
बुलिश पताका
was formed on 21.04 at 10:06:26 (UTC+0)
signal strength 1 of 5

बुलिश पताका ग्राफ़िक पैटर्न NZDUSD M5 इंस्ट्रूमेंट पर बना है। यह निरंतरता पैटर्न की श्रेणी में आता है। इस मामले में, यदि भाव उच्च स्तर पर टूटता है, तो इसके
M5 और M15 समय सीमा में अधिक फाल्स एंट्री पॉइंट्स हो सकते हैं।
Open chart in a new window