वास्तविक पैटर्न

पैटर्न ग्राफिकल मॉडल हैं जो चार्ट में मूल्य से बने होते हैं। तकनीकी विश्लेषण भविष्यवाणियों में से एक के अनुसार, इतिहास का मतलब मूल्य आंदोलन खुद को दोहराता है। इसका मतलब है कि मूल्य आंदोलन अक्सर एक ही परिस्थितियों में समान होते हैं जो उच्च संभावना के साथ स्थिति के आगे के विकास की भविष्यवाणी करना संभव बनाता है।
इंस्टा फॉरेक्स द्वारा प्रासंगिक पैटर्न एक उपयोग में आसान सेवा है जो आपको बाजार में नवीनतम परिवर्तनों के बारे में जागरूक होने और समय पर बाजार से संकेतों पर प्रतिक्रिया करने की अनुमति देती है। हमारी सेवा में आप हमेशा किसी भी जोड़ी और किसी भी समय सीमा पर नवीनतम और सबसे प्रासंगिक पैटर्न प्राप्त कर सकते हैं.
Bullish Flag
was formed on 16.04 at 07:00:28 (UTC+0)
signal strength 2 of 5

The Bullish Flag pattern has been formed on GBPUSD at M15. The lower boundary of the pattern is located at 1.3255/1.3255, while the higher boundary lies at 1.3263/1.3263. The projection of the flagpole is 19 points. This formation signals that the upward trend is most likely to continue. Therefore, if the level of 1.3263 is broken, the price will move further upwards.
The M5 and M15 time frames may have more false entry points.
See Also
- All
- All
- Bearish Rectangle
- Bearish Symmetrical Triangle
- Bearish Symmetrical Triangle
- Bullish Rectangle
- Double Top
- Double Top
- Triple Bottom
- Triple Bottom
- Triple Top
- Triple Top
- All
- All
- Buy
- Sale
- All
- 1
- 2
- 3
- 4
- 5
Double Bottom
was formed on 21.04 at 19:20:14 (UTC+0)
signal strength 1 of 5
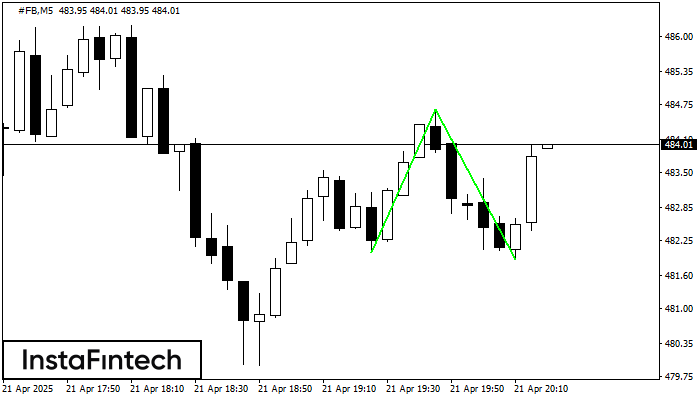
The Double Bottom pattern has been formed on #FB M5; the upper boundary is 484.65; the lower boundary is 481.90. The width of the pattern is 263 points. In case
The M5 and M15 time frames may have more false entry points.
Open chart in a new window
Triple Bottom
was formed on 21.04 at 19:00:13 (UTC+0)
signal strength 1 of 5
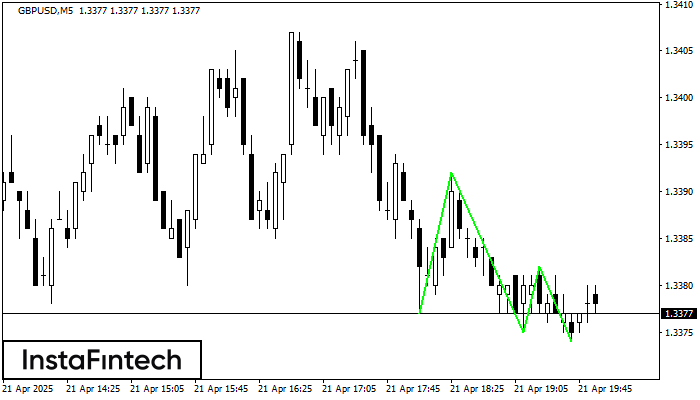
The Triple Bottom pattern has been formed on GBPUSD M5. It has the following characteristics: resistance level 1.3392/1.3382; support level 1.3377/1.3374; the width is 15 points. In the event
The M5 and M15 time frames may have more false entry points.
Open chart in a new window
Triple Bottom
was formed on 21.04 at 18:40:14 (UTC+0)
signal strength 1 of 5

The Triple Bottom pattern has formed on the chart of the #AMZN M5 trading instrument. The pattern signals a change in the trend from downwards to upwards in the case
The M5 and M15 time frames may have more false entry points.
Open chart in a new window