Өзекті паттерндер

Прямоугольник
сформирован 21.03 в 00:21:22 (UTC+0)
сила сигнала 1 из 5
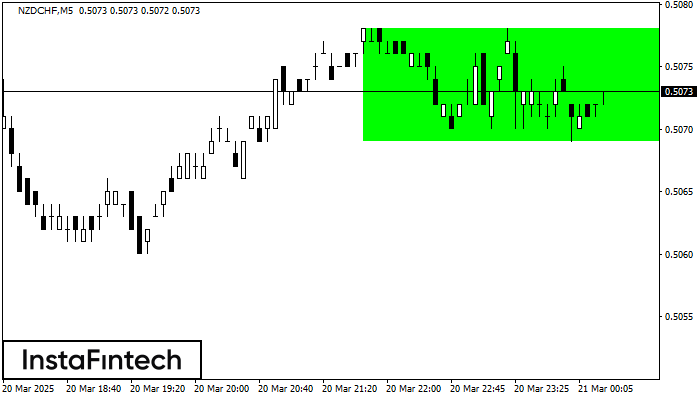
По NZDCHF на M5 сформировалась фигура «Прямоугольник». Фигура данного типа относится к тому типу продолжения тренда, который содержит в себе два уровня: Сопротивление 0.5078; Поддержка 0.5069. В случае пробоя уровня сопротивления 0.5078 возможно дальнейшее восходящее движение.
Таймфреймы М5 и М15 могут иметь больше ложных точек входа.
Сондай-ақ қараңыз
- Все
- Все
- Bearish Rectangle
- Bearish Symmetrical Triangle
- Bearish Symmetrical Triangle
- Bullish Rectangle
- Double Top
- Double Top
- Triple Bottom
- Triple Bottom
- Triple Top
- Triple Top
- Все
- Все
- Покупка
- Продажа
- Все
- 1
- 2
- 3
- 4
- 5
Double Bottom
was formed on 16.04 at 09:40:26 (UTC+0)
signal strength 1 of 5
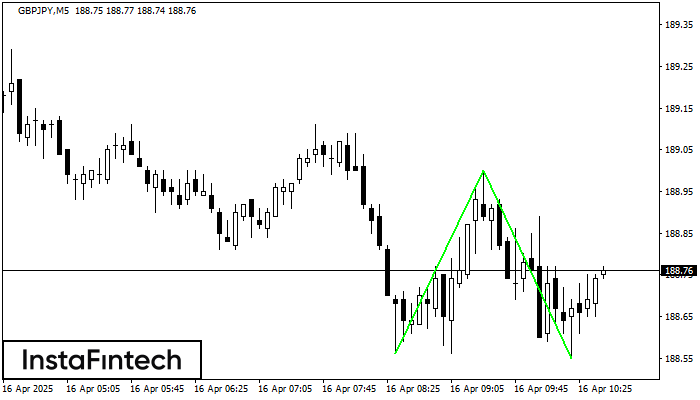
The Double Bottom pattern has been formed on GBPJPY M5; the upper boundary is 189.00; the lower boundary is 188.55. The width of the pattern is 44 points. In case
The M5 and M15 time frames may have more false entry points.
Open chart in a new window
Double Bottom
was formed on 16.04 at 09:36:01 (UTC+0)
signal strength 1 of 5
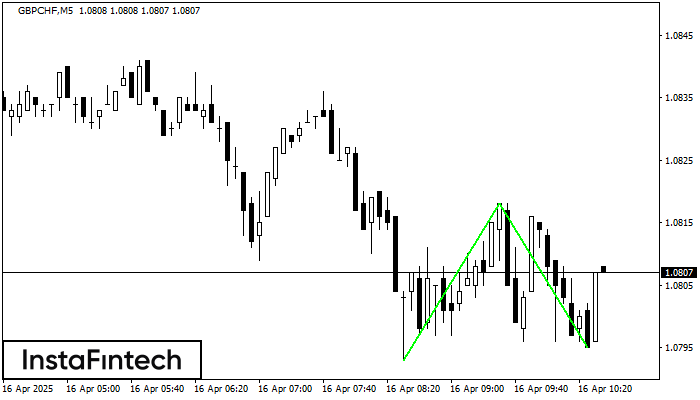
The Double Bottom pattern has been formed on GBPCHF M5. This formation signals a reversal of the trend from downwards to upwards. The signal is that a buy trade should
The M5 and M15 time frames may have more false entry points.
Open chart in a new window
Double Top
was formed on 16.04 at 09:00:29 (UTC+0)
signal strength 4 of 5
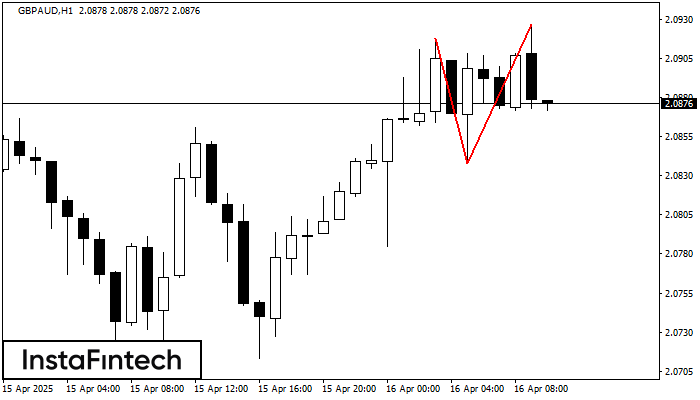
On the chart of GBPAUD H1 the Double Top reversal pattern has been formed. Characteristics: the upper boundary 2.0927; the lower boundary 2.0838; the width of the pattern 89 points
Open chart in a new window