Lihat juga


 21.12.2023 01:12 PM
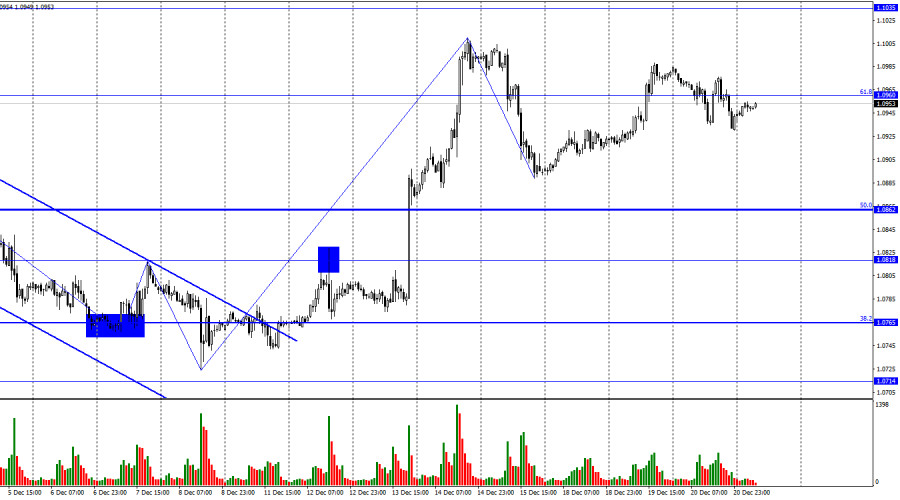
The EUR/USD pair reversed in favor of the U.S. dollar on Wednesday, consolidating below the corrective level of 61.8% (1.0960). Thus, the downward process may continue toward the next Fibonacci level of 50.0% (1.0862). I support the scenario of further decline in the pair, as, judging by the waves, the trend seems to be shifting towards the "bearish" side. However, a firm hold above the level of 1.0960 will indicate that bulls are not ready to retreat fully and may attempt to resume growth towards the level of 1.1035.
The wave situation is becoming clearer and more favorable. The last downward wave turned out to be relatively weak (compared to the previous upward wave), and the current upward wave has every chance of not surpassing the peak of the previous wave (from December 14). If this scenario unfolds, we will have the first sign of completing the "bullish" trend. In this case, a decline towards the level of 1.0862 should begin, which may only be the start of a prolonged "bearish" trend. This is the scenario I am currently counting on.
On Wednesday, there were a few interesting events in the European Union and the United States. The only U.S. report on the number of new home sales showed a value slightly higher than traders expected for November. However, this report is unimportant, and traders' reactions were practically nonexistent. Thus, this week, I can highlight only two events. The first one is the inflation report in the European Union, which showed a final decrease in November to 2.4% y/y, and the U.S. GDP report for the third quarter, which will be released today in the second half of the day.
As with European inflation, the report on economic growth in the U.S. may not cause a strong reaction. This is not the first estimate of the indicator for the third quarter, and traders are prepared to see +5.2% q/q. If today's report shows a higher or lower value, then bulls or bears will receive minor support. But overall, this week's information background is quite weak, with important reports coming only from the United Kingdom. By the end of the week, trader activity may be relatively low, but I still expect a decline in the pair toward the level of 1.0862. This target already looks quite attractive.
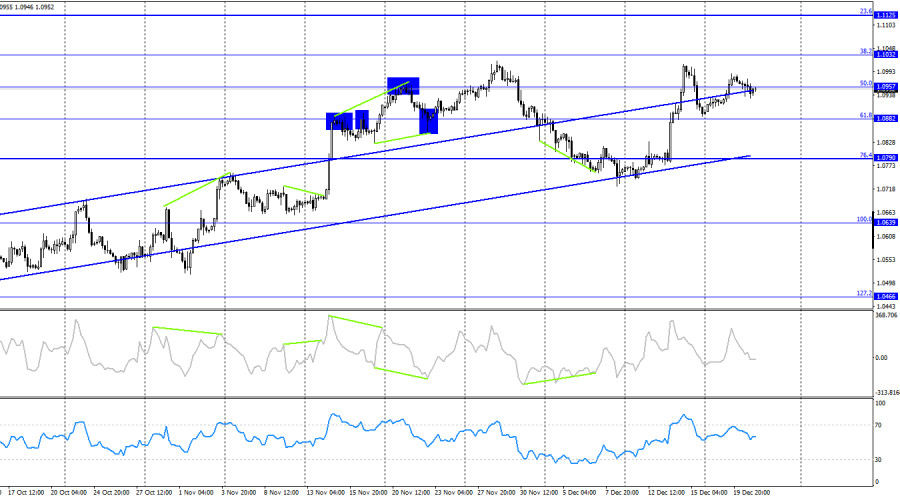
On the 4-hour chart, the pair rose to the corrective level of 50.0% (1.0957). A firm consolidation of the pair's rate above this level allows counting on further growth towards the next Fibonacci level of 38.2% at 1.1032. Reconsolidation below 1.0957 will again favor the U.S. currency and a fall to the lower line of the ascending trend corridor, which still characterizes traders' sentiment as "bullish." I expect a significant decline in the euro only after consolidating below the ascending trend corridor. Still, even under the current circumstances, a decline towards the lower line of the corridor looks promising. There are no apparent divergences with any indicator today.
Forecast for EUR/USD and trader advice:
What advice can be given to traders today? The rise of the European currency is unlikely. The continuation of the "bullish" trend is also unlikely. The information background could be stronger; the economic events calendar for the EU and the U.S. is practically empty, and traders will find it difficult to find new reasons for buying. Thus, a resumption of the decline towards the level of 1.0862 is likely. A consolidation below the level of 1.0960 can be considered for selling the pair. I consider purchases today impractical and too risky."
You have already liked this post today
* Analisis pasaran yang disiarkan di sini adalah bertujuan untuk meningkatkan kesedaran anda, tetapi tidak untuk memberi arahan untuk membuat perdagangan.
Pada awal sesi dagangan Amerika, pasangan EUR/USD didagangkan sekitar paras 1.1358 dalam saluran menurun yang terbentuk sejak 18 April. Pasangan ini masih berada di bawah tekanan menurun. Kami berpendapat instrumen
Harga emas baru-baru ini mengalami pembetulan yang ketara berikutan jangkaan pasaran terhadap permulaan rundingan sebenar antara Amerika Syarikat dan China berhubung tarif serta perdagangan secara keseluruhan. Kenyataan Setiausaha Perbendaharaan
Pada carta 4 jam, instrumen komoditi Silver kelihatan meskipun keadaannya mengukuh di mana ini disahkan oleh pergerakan harga Silver yang bergerak di atas WMA (30 Shift 2) yang juga mempunyai
Walaupun pada carta 4 jam indeks Nasdaq 100 berada dalam keadaan mendatar (Sideways), julat pergerakannya masih cukup luas, sekali gus menawarkan peluang yang agak menarik pada indeks ini. Ketika
Rancangan dagangan kami untuk beberapa jam akan datang adalah menjual emas di bawah $3,333, dengan sasaran pada $3,313 dan $3,291. Kami boleh membeli di atas $3,280 dengan sasaran jangka pendek
Dengan kemunculan Divergence antara pergerakan harga pasangan mata wang silang AUD/JPY dengan penunjuk Pengayun Stochastic dan pergerakan harga AUD/JPY yang berada di atas WMA (30 Shift 2) yang juga mempunyai
Jika kita melihat carta 4 jam, instrumen komoditi Emas masih menunjukkan kecenderungan Menaik, namun kemunculan Perbezaan (Divergence) antara pergerakan harga Emas dan penunjuk Pengayun Stochastic memberi isyarat bahawa dalam masa
Jika kita meneliti carta 4 jam bagi pasangan silang mata wang GBP/CHF, terdapat beberapa fakta menarik. Pertama sekali, kemunculan corak Segitiga yang diiringi oleh purata bergerak eksponen EMA (21) yang
Dengan pergerakan harga pasangan mata wang silang AUD/CAD bergerak di atas WMA (21) yang mempunyai cerun menaik dan penampilan Konvergensi antara pergerakan harga AUD/CAD dan penunjuk Pengayun Stochastic, ia memberikan
Penunjuk eagle telah mencapai tahap terlebih beli. Walau bagaimanapun, logam tersebut masih boleh mencapai paras tinggi sekitar 8/8 Murray, yang mewakili rintangan kuat untuk emas. Di bawah kawasan ini, kita
Video latihan

Your IP address shows that you are currently located in the USA. If you are a resident of the United States, you are prohibited from using the services of InstaFintech Group including online trading, online transfers, deposit/withdrawal of funds, etc.
If you think you are seeing this message by mistake and your location is not the US, kindly proceed to the website. Otherwise, you must leave the website in order to comply with government restrictions.
Why does your IP address show your location as the USA?
Please confirm whether you are a US resident or not by clicking the relevant button below. If you choose the wrong option, being a US resident, you will not be able to open an account with InstaTrade anyway.
We are sorry for any inconvenience caused by this message.


