Lihat juga


 18.03.2025 11:03 AM
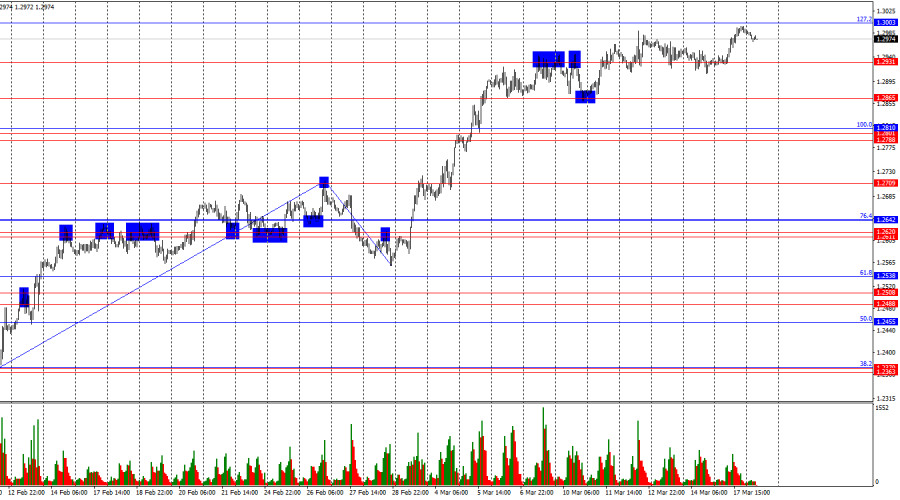
On the hourly chart, GBP/USD rebounded from the 1.2931 level on Monday and resumed its upward movement toward the 127.2% Fibonacci level at 1.3003. A rejection from this level would favor the U.S. dollar and lead to a slight decline toward 1.2931. A break and consolidation above 1.3003 would indicate continued growth toward the next level at 1.3151.
The wave pattern is absolutely clear. The last completed downward wave did not break the previous low, while the last upward wave surpassed the previous peak. This confirms that the bullish trend is still forming. The British pound has recently shown very strong growth, perhaps even excessive. The fundamental backdrop is not strong enough to justify such aggressive bullish action. However, most traders refuse to buy the dollar regardless of economic data because Donald Trump continuously imposes new tariffs, which will eventually harm U.S. economic growth and that of many other countries.
Monday's fundamental backdrop was weak, but bullish traders took advantage of one of the few opportunities available—a weak U.S. retail sales report. However, the market is now shifting its focus to more important events this week, namely the FOMC meeting on Wednesday and the Bank of England meeting on Thursday. Judging by the continued decline of the U.S. dollar, bears are not expecting any positive news.
Traders expect the FOMC to soften its monetary policy rhetoric, given expectations of an economic slowdown in the coming quarters. However, I do not believe the Fed will aggressively ease policy, as U.S. inflation remains elevated. As for the Bank of England, interest rates are expected to remain unchanged, and the UK economy is not showing clear signs of acceleration or slowdown. Trump has not imposed tariffs on the UK, and there is no fundamental reason for the British economy to grow significantly.
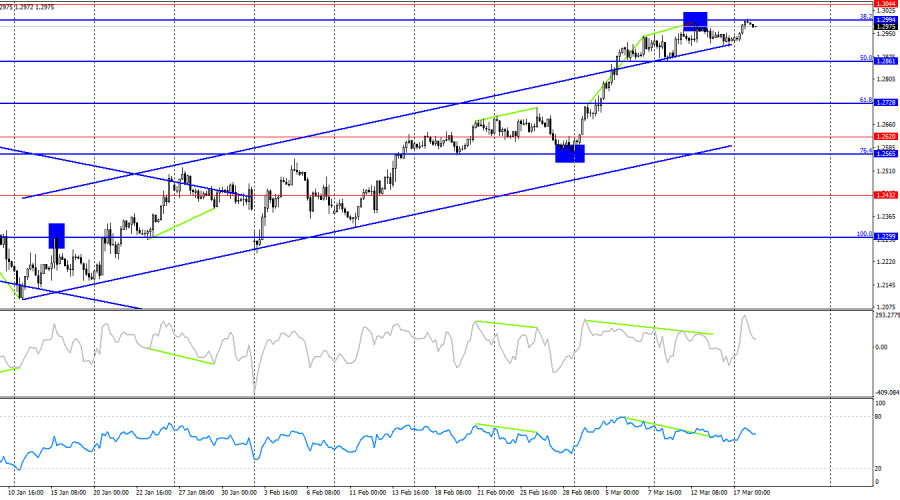
On the 4-hour chart, the bullish trend continues. I do not expect a significant decline in GBP/USD unless the pair closes below the rising channel. The CCI indicator has formed a bearish divergence, but so far, it has had no impact on bulls' positions. A rejection from 1.2994 could lead to a moderate pullback toward the 50.0% Fibonacci level at 1.2861, but bears are absent from the market.
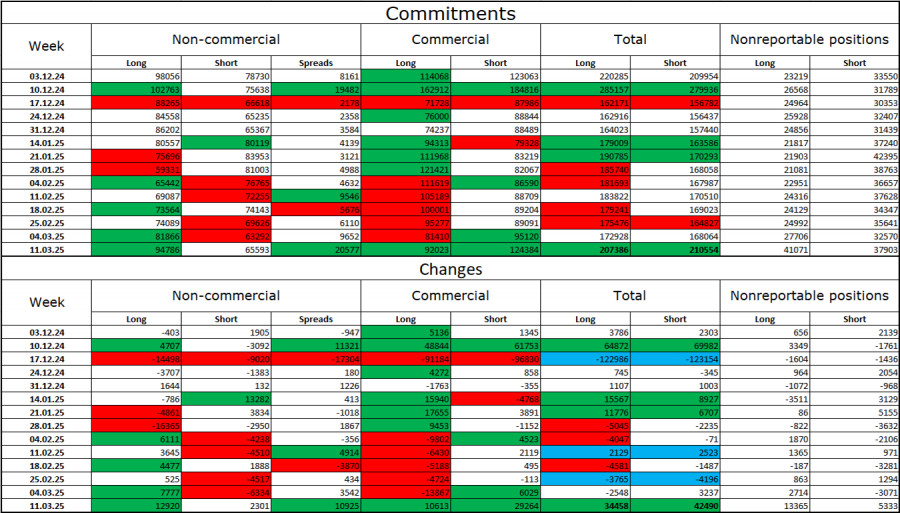
The Non-commercial category of traders became even more bullish last week. The number of long positions held by speculators increased by 12,920, while short positions increased by only 2,301. Bears have lost their market advantage, with the gap between long and short positions now nearly 30,000 in favor of bulls (95,000 vs. 66,000).
In my opinion, the British pound still has room for a decline, but recent events could force the market into a long-term shift. Over the past three months, the number of long positions decreased from 98,000 to 94,000, while short positions dropped from 78,000 to 66,000. However, the more significant trend is that in the last six weeks, long positions have surged from 59,000 to 95,000, while short positions have fallen from 81,000 to 66,000. Let's not forget—this has been "six weeks under Trump."
On Tuesday, the economic calendar includes three events, but all of them are second-tier data. The overall market impact is expected to be weak.
Short positions were possible on a rejection from 1.2994 on the 4-hour chart, targeting 1.2931 and 1.2865. These trades can remain open, but bearish activity in the market is minimal. Long positions are viable on a rebound from 1.2931 on the hourly chart or after a breakout above 1.3003, with a target at 1.3151.
Fibonacci retracement grids are drawn from 1.2809 to 1.2100 on the hourly chart and from 1.2299 to 1.3432 on the 4-hour chart.
You have already liked this post today
* Analisis pasaran yang disiarkan di sini adalah bertujuan untuk meningkatkan kesedaran anda, tetapi tidak untuk memberi arahan untuk membuat perdagangan.
Dengan keadaan kedua-dua EMA melintasi Golden Cross dan RSI pada tahap Extreme-Bullish hari ini, pembeli masih menguasai XAU/USD. Tahap Utama 1. Rintangan 2: 4021.88 2. Rintangan 1: 4003.09 3. Pivot
Sekiranya emas mencapai paras 3,977 dan gagal untuk mengukuh harga di atas kawasan ini, kita boleh menjangkakan pembentukan corak gandaan dua (double top) atau gandaan tiga (triple top), yang boleh
Secara teknikal, pada carta H4, Bitcoin sedang menunjukkan perbezaan negatif. Oleh itu, sekiranya harga berlegar di bawah $125,000 dalam beberapa hari akan datang, sebarang lantunan teknikal akan dianggap sebagai isyarat
Video latihan

Your IP address shows that you are currently located in the USA. If you are a resident of the United States, you are prohibited from using the services of InstaFintech Group including online trading, online transfers, deposit/withdrawal of funds, etc.
If you think you are seeing this message by mistake and your location is not the US, kindly proceed to the website. Otherwise, you must leave the website in order to comply with government restrictions.
Why does your IP address show your location as the USA?
Please confirm whether you are a US resident or not by clicking the relevant button below. If you choose the wrong option, being a US resident, you will not be able to open an account with InstaTrade anyway.
We are sorry for any inconvenience caused by this message.


