Corak sebenar

Double Bottom
was formed on 20.03 at 02:40:21 (UTC+0)
signal strength 1 of 5
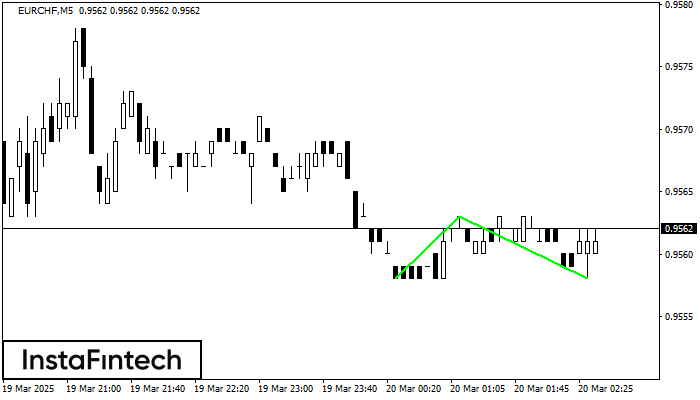
The Double Bottom pattern has been formed on EURCHF M5; the upper boundary is 0.9563; the lower boundary is 0.9558. The width of the pattern is 5 points. In case of a break of the upper boundary 0.9563, a change in the trend can be predicted where the width of the pattern will coincide with the distance to a possible take profit level.
The M5 and M15 time frames may have more false entry points.
Juga lihat
- All
- All
- Bearish Rectangle
- Bearish Symmetrical Triangle
- Bearish Symmetrical Triangle
- Bullish Rectangle
- Double Top
- Double Top
- Triple Bottom
- Triple Bottom
- Triple Top
- Triple Top
- All
- All
- Buy
- Sale
- All
- 1
- 2
- 3
- 4
- 5
Triple Bottom
was formed on 21.03 at 14:00:13 (UTC+0)
signal strength 4 of 5
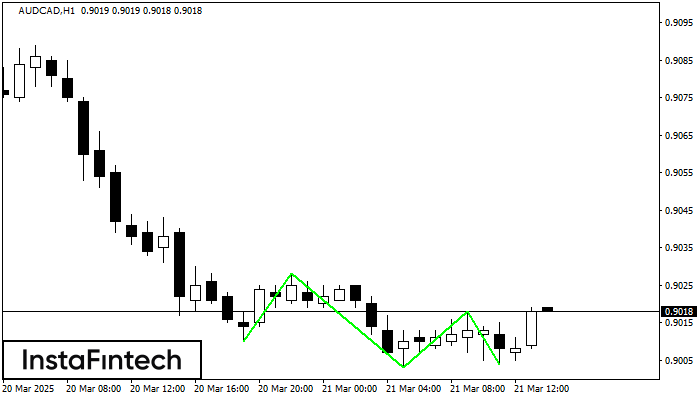
Corak Triple Bottom telah dibentuk pada carta bagi instrumen dagangan AUDCAD H1. Corak menandakan perubahan aliran dari menurun ke aliran menaik dalam sekiranya penembusan 0.9028/0.9018
Open chart in a new window
Segi Tiga Simetri Menaik
was formed on 21.03 at 13:36:59 (UTC+0)
signal strength 1 of 5
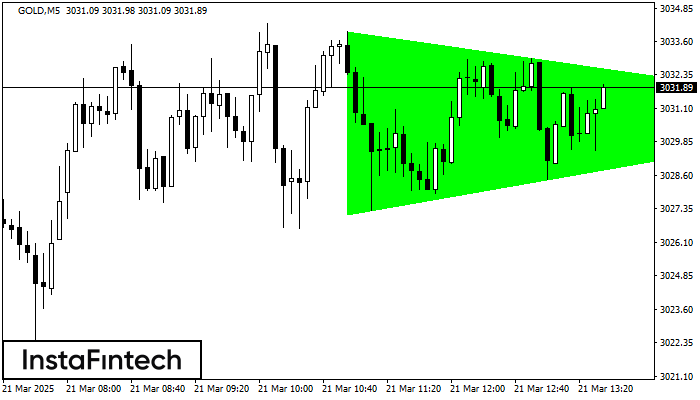
Berdasarkan carta M5, GOLD membentuk corak Segi Tiga Simetri Menaik. Sempadan yang lebih rendah bagi corak yang menyentuh koordinat 3027.13/3030.88 di mana sempadan atas merentasi 3033.97/3030.88. Sekiranya corak Segi Tiga
Carta masa M5 dan M15 mungkin mempunyai lebih banyak titik kemasukan palsu.
Open chart in a new window
Triple Bottom
was formed on 21.03 at 13:30:17 (UTC+0)
signal strength 3 of 5
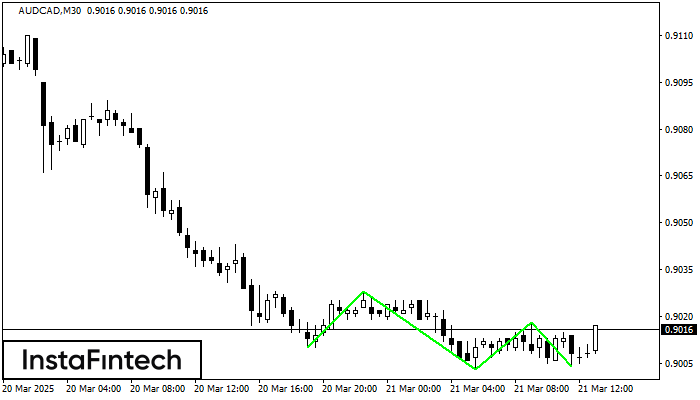
Corak Triple Bottom telah dibentuk pada AUDCAD M30. Ia mempunyai ciri-ciri berikut: tahap rintangan 0.9028/0.9018; tahap sokongan 0.9010/0.9004; lebar corak adalah 18 mata. Dalam situasi penembusan paras rintangan 0.9028, harga
Open chart in a new window