Corak sebenar

Triple Bottom
was formed on 26.03 at 07:00:22 (UTC+0)
signal strength 3 of 5
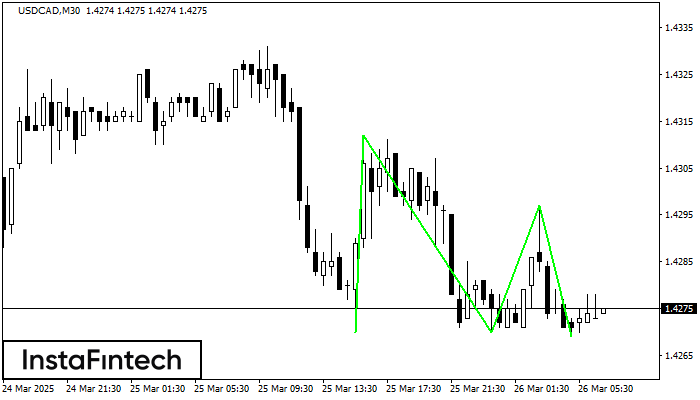
The Triple Bottom pattern has formed on the chart of USDCAD M30. Features of the pattern: The lower line of the pattern has coordinates 1.4312 with the upper limit 1.4312/1.4297, the projection of the width is 42 points. The formation of the Triple Bottom pattern most likely indicates a change in the trend from downward to upward. This means that in the event of a breakdown of the resistance level 1.4270, the price is most likely to continue the upward movement.
- All
- All
- Bearish Rectangle
- Bearish Symmetrical Triangle
- Bearish Symmetrical Triangle
- Bullish Rectangle
- Double Top
- Double Top
- Triple Bottom
- Triple Bottom
- Triple Top
- Triple Top
- All
- All
- Buy
- Sale
- All
- 1
- 2
- 3
- 4
- 5
Segi Tiga Simetri Menaik
was formed on 21.04 at 15:33:18 (UTC+0)
signal strength 2 of 5

Berdasarkan carta M15, #Bitcoin membentuk corak Segi Tiga Simetri Menaik. Penerangan: Ini adalah corak kesinambungan aliran. 87754.54 dan 86429.29 adalah koordinat sempadan atas dan bawah masing-masing. Lebar corak diukur pada
Carta masa M5 dan M15 mungkin mempunyai lebih banyak titik kemasukan palsu.
Open chart in a new window
Double Bottom
was formed on 21.04 at 15:29:52 (UTC+0)
signal strength 3 of 5

Corak Double Bottom telah dibentuk pada GBPCHF M30. Pembentukan ini menandakan pembalikan aliran dari aliran menurun ke atas. Isyarat ialah perdagangan membeli harus dibuka selepas sempadan atas corak 1.0810 telah
Open chart in a new window
Segi Tiga Simetri Menaik
was formed on 21.04 at 14:53:30 (UTC+0)
signal strength 1 of 5

Berdasarkan carta M5, EURUSD membentuk corak Segi Tiga Simetri Menaik. Sempadan yang lebih rendah bagi corak yang menyentuh koordinat 1.1501/1.1531 di mana sempadan atas merentasi 1.1573/1.1531. Sekiranya corak Segi Tiga
Carta masa M5 dan M15 mungkin mempunyai lebih banyak titik kemasukan palsu.
Open chart in a new window