Corak sebenar

Bullish pennant
was formed on 27.03 at 18:14:41 (UTC+0)
signal strength 3 of 5
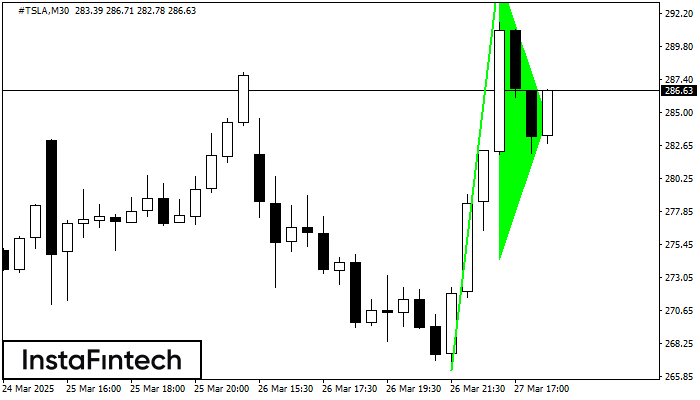
The Bullish pennant signal – Trading instrument #TSLA M30, continuation pattern. Forecast: it is possible to set up a buy position above the pattern’s high of 294.87, with the prospect of the next move being a projection of the flagpole height.
- All
- All
- Bearish Rectangle
- Bearish Symmetrical Triangle
- Bearish Symmetrical Triangle
- Bullish Rectangle
- Double Top
- Double Top
- Triple Bottom
- Triple Bottom
- Triple Top
- Triple Top
- All
- All
- Buy
- Sale
- All
- 1
- 2
- 3
- 4
- 5
Bearish Symmetrical Triangle
was formed on 21.04 at 13:29:27 (UTC+0)
signal strength 1 of 5

According to the chart of M5, AUDCHF formed the Bearish Symmetrical Triangle pattern. Description: The lower border is 0.5164/0.5181 and upper border is 0.5203/0.5181. The pattern width is measured
The M5 and M15 time frames may have more false entry points.
Open chart in a new window
Triple Top
was formed on 21.04 at 12:40:05 (UTC+0)
signal strength 1 of 5

On the chart of the GOLD M5 trading instrument, the Triple Top pattern that signals a trend change has formed. It is possible that after formation of the third peak
The M5 and M15 time frames may have more false entry points.
Open chart in a new window
Bearish Symmetrical Triangle
was formed on 21.04 at 12:20:58 (UTC+0)
signal strength 1 of 5

According to the chart of M5, GBPCHF formed the Bearish Symmetrical Triangle pattern. Trading recommendations: A breach of the lower border 1.0783 is likely to encourage a continuation
The M5 and M15 time frames may have more false entry points.
Open chart in a new window