Corak sebenar

Bullish pennant
was formed on 01.04 at 07:16:47 (UTC+0)
signal strength 1 of 5
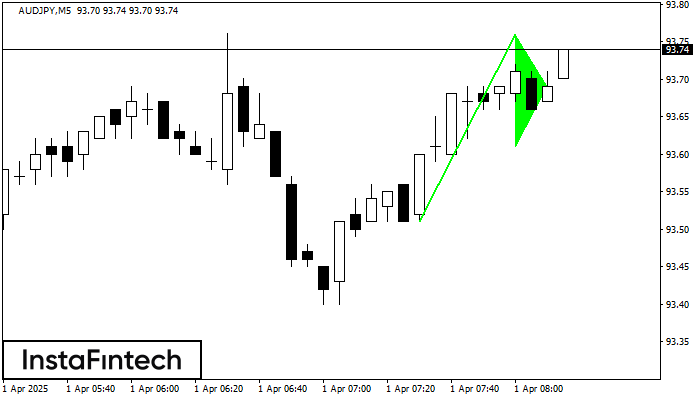
The Bullish pennant graphic pattern has formed on the AUDJPY M5 instrument. This pattern type falls under the category of continuation patterns. In this case, if the quote can breaks out high, is expected to continue the upward trend to level 93.91.
The M5 and M15 time frames may have more false entry points.
- All
- All
- Bearish Rectangle
- Bearish Symmetrical Triangle
- Bearish Symmetrical Triangle
- Bullish Rectangle
- Double Top
- Double Top
- Triple Bottom
- Triple Bottom
- Triple Top
- Triple Top
- All
- All
- Buy
- Sale
- All
- 1
- 2
- 3
- 4
- 5
Bullish Symmetrical Triangle
was formed on 21.04 at 14:53:30 (UTC+0)
signal strength 1 of 5

According to the chart of M5, EURUSD formed the Bullish Symmetrical Triangle pattern. The lower border of the pattern touches the coordinates 1.1501/1.1531 whereas the upper border goes across 1.1573/1.1531
The M5 and M15 time frames may have more false entry points.
Open chart in a new window
Double Top
was formed on 21.04 at 14:39:59 (UTC+0)
signal strength 1 of 5
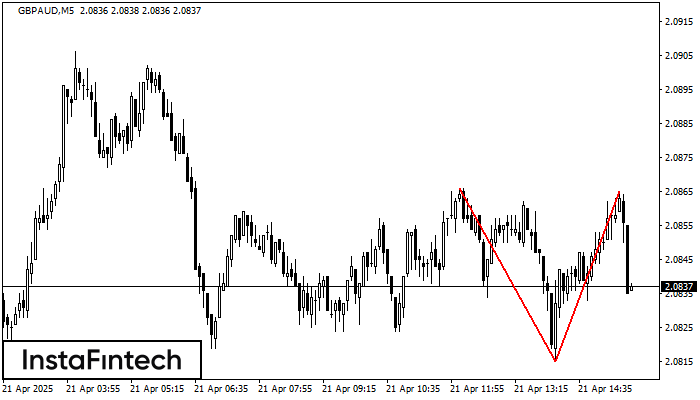
The Double Top reversal pattern has been formed on GBPAUD M5. Characteristics: the upper boundary 2.0866; the lower boundary 2.0815; the width of the pattern is 50 points. Sell trades
The M5 and M15 time frames may have more false entry points.
Open chart in a new window
Triple Top
was formed on 21.04 at 14:30:15 (UTC+0)
signal strength 2 of 5
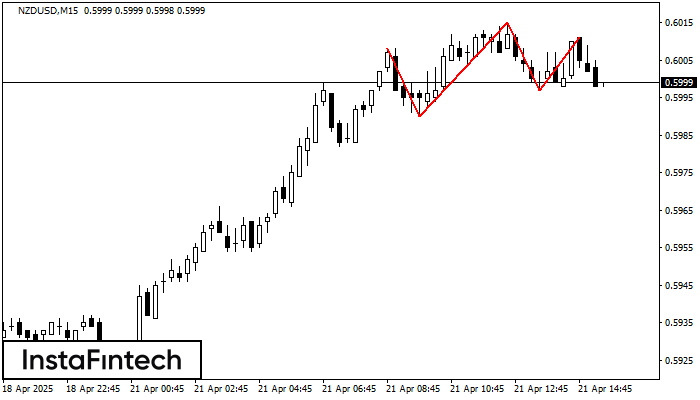
On the chart of the NZDUSD M15 trading instrument, the Triple Top pattern that signals a trend change has formed. It is possible that after formation of the third peak
The M5 and M15 time frames may have more false entry points.
Open chart in a new window