یہ بھی دیکھیں


 24.01.2025 05:24 AM
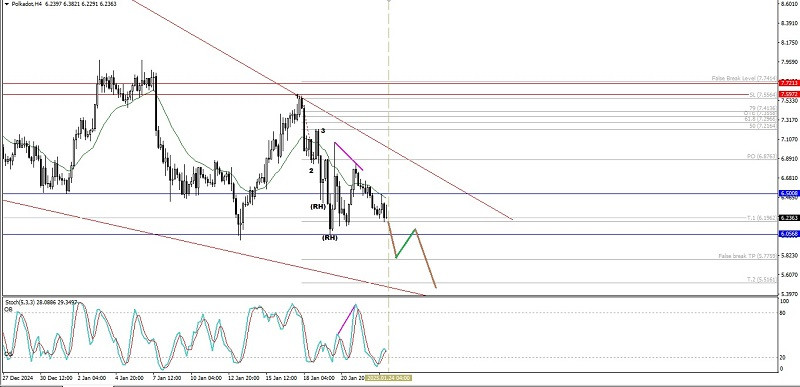
From what is seen on the 4-hour chart of the Polkadot cryptocurrency, it appears that the price movement is showing a Bearish 123 pattern followed by the Bearish Ross Hook (RH) coupled with the appearance of convergence between the Polkadot price movement and the Stochastic Oscillator indicator and the Polkadot price movement which is below the EMA (21) which has a decreasing slope, then Polkadot is predicted to experience a weakening in the near future where the level of 6.1962 will be attempted to be broken if successful then Polkadot has the potential to continue its weakening to the level of 5.7759 as its main target and if the momentum of the weakening and its volatility support then 5.5161 will be the next target but if on its way to the targets of these levels suddenly there is a strengthening again until it breaks through and closes above the level of 7.0714 then all the downward scenarios that have been described will be canceled by themselves.
(Disclaimer)
You have already liked this post today
*تعینات کیا مراد ہے مارکیٹ کے تجزیات یہاں ارسال کیے جاتے ہیں جس کا مقصد آپ کی بیداری بڑھانا ہے، لیکن تجارت کرنے کے لئے ہدایات دینا نہیں.

