Padrões atuais

Padrões são modelos gráficos que são formados no gráfico pelo preço. Segundo um dos postulados da análise técnica, a história (movimento de preços) se repete. Isso significa que os movimentos de preços geralmente são semelhantes nas mesmas situações, o que possibilita prever o desenvolvimento futuro da situação com alta probabilidade.
Os padrões relevantes da InstaTrade são um serviço fácil de usar, que permite que você esteja ciente das últimas mudanças no mercado e reaja a indícios do mercado a tempo. Em nosso serviço, você sempre encontrará os padrões mais recentes e relevantes em qualquer par e em qualquer período gráfico.
Double Top
was formed on 31.03 at 04:40:34 (UTC+0)
signal strength 1 of 5
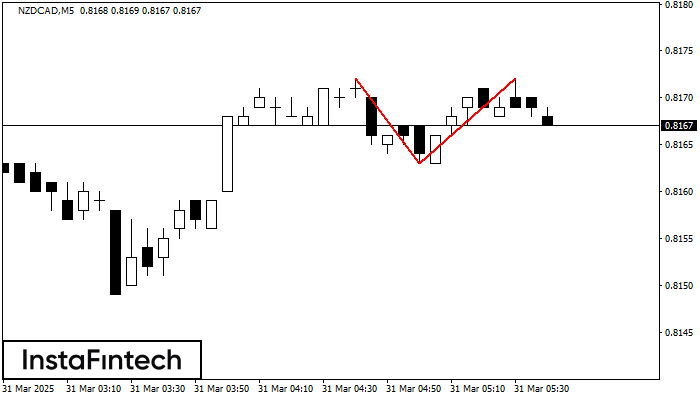
On the chart of NZDCAD M5 the Double Top reversal pattern has been formed. Characteristics: the upper boundary 0.8172; the lower boundary 0.8163; the width of the pattern 9 points. The signal: a break of the lower boundary will cause continuation of the downward trend targeting the 0.8148 level.
The M5 and M15 time frames may have more false entry points.
- All
- All
- Bearish Rectangle
- Bearish Symmetrical Triangle
- Bearish Symmetrical Triangle
- Bullish Rectangle
- Double Top
- Double Top
- Triple Bottom
- Triple Bottom
- Triple Top
- Triple Top
- All
- All
- Buy
- Sale
- All
- 1
- 2
- 3
- 4
- 5
Fundo triplo
was formed on 21.04 at 22:01:24 (UTC+0)
signal strength 3 of 5

O padrão Fundo triplo foi formado no gráfico do instrumento de negociação USDJPY M30. O padrão sinaliza uma mudança na tendência de baixa para alta no caso de quebra
Open chart in a new window
Fundo duplo
was formed on 21.04 at 22:00:49 (UTC+0)
signal strength 4 of 5

O padrão Fundo duplo foi formado em AUDCHF H1; o limite superior é 0.5198; o limite inferior é 0.5165. A largura do padrão é de 34 pontos. No caso
Open chart in a new window
Triângulo Simétrico de Baixa
was formed on 21.04 at 21:58:31 (UTC+0)
signal strength 1 of 5
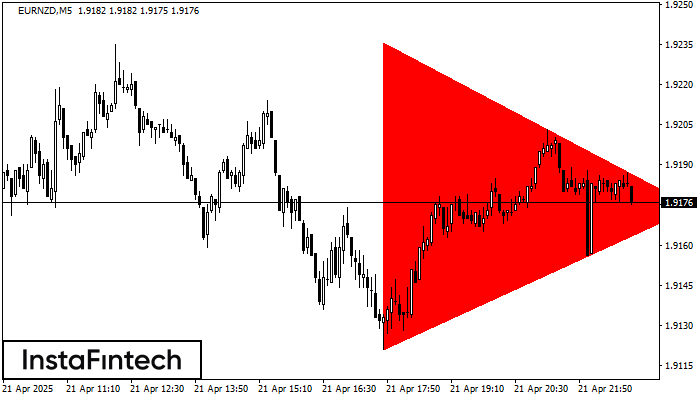
De acordo com o gráfico de M5, EURNZD formou o padrão Triângulo Simétrico de Baixa. Descrição: o limite inferior é 1.9121/1.9174 e o limite superior é 1.9236/1.9174. A largura
Os intervalos M5 e M15 podem ter mais pontos de entrada falsos.
Open chart in a new window