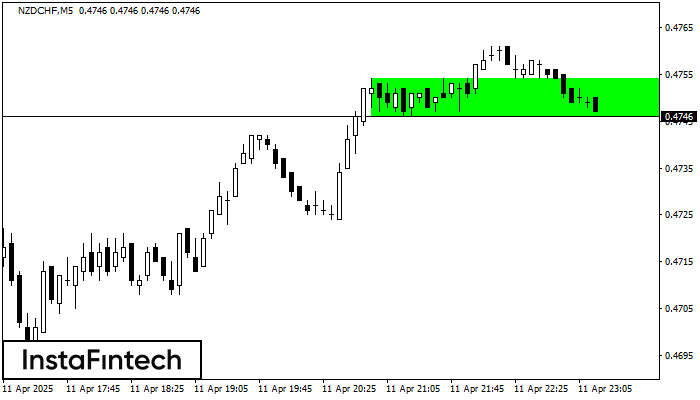
Bullish Rectangle
was formed on 11.04 at 22:20:31 (UTC+0)
signal strength 1 of 5

According to the chart of M5, NZDCHF formed the Bullish Rectangle. The pattern indicates a trend continuation. The upper border is 0.4754, the lower border is 0.4746. The signal means that a long position should be opened above the upper border 0.4754 of the Bullish Rectangle.
The M5 and M15 time frames may have more false entry points.
- All
- All
- Bearish Rectangle
- Bearish Symmetrical Triangle
- Bearish Symmetrical Triangle
- Bullish Rectangle
- Double Top
- Double Top
- Triple Bottom
- Triple Bottom
- Triple Top
- Triple Top
- All
- All
- Buy
- Sale
- All
- 1
- 2
- 3
- 4
- 5
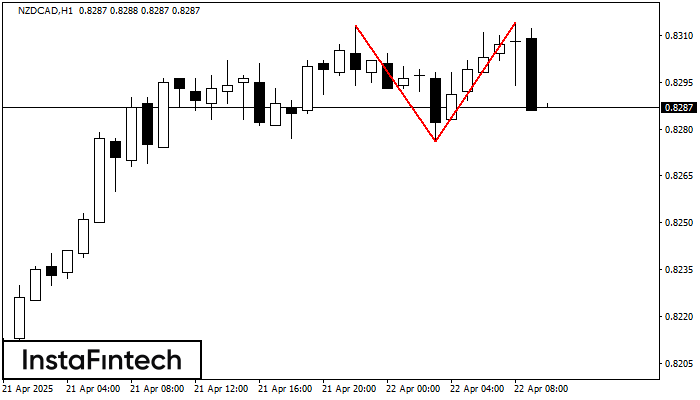
Topo duplo
was formed on 22.04 at 09:00:07 (UTC+0)
signal strength 4 of 5
O padrão Topo duplo foi formado em NZDCAD H1. Isso sinaliza que a tendência foi alterada de cima para baixo. Provavelmente, se a base do padrão 0.8276 for quebrada
Open chart in a new window
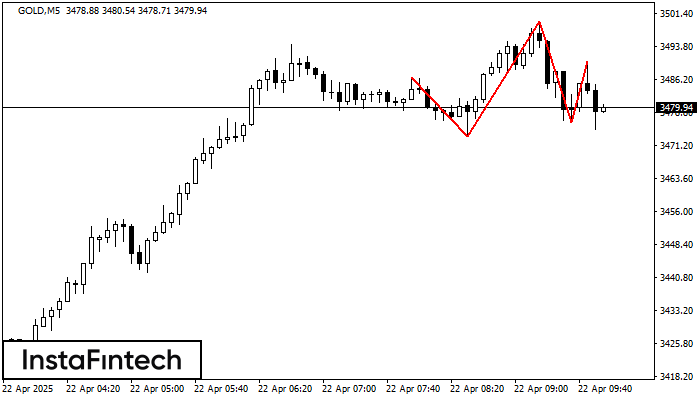
Cabeça & Ombros
was formed on 22.04 at 08:55:22 (UTC+0)
signal strength 1 of 5
O padrão técnico chamado Cabeça & Ombros apareceu no gráfico de GOLD M5. Há razões de peso para sugerir que o preço ultrapassará a Linha do Pescoço 3473.12/3476.36 após
Os intervalos M5 e M15 podem ter mais pontos de entrada falsos.
Open chart in a new window
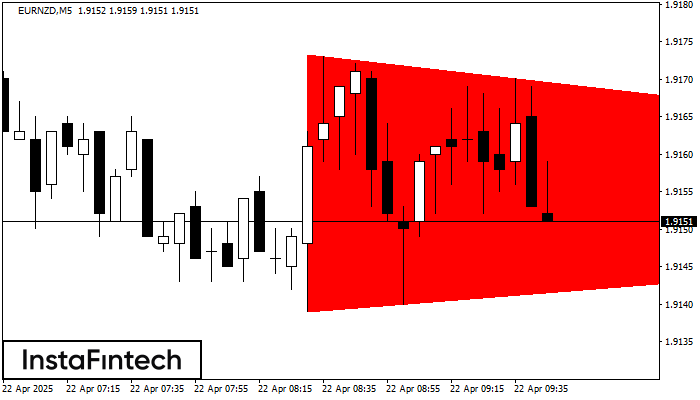
Triângulo Simétrico de Baixa
was formed on 22.04 at 08:47:25 (UTC+0)
signal strength 1 of 5
De acordo com o gráfico de M5, EURNZD fomrou o padrão de Triângulo Simétrico de Baixa. Este padrão sinaliza uma nova tendência de baixa se o limite inferior 1.9139
Os intervalos M5 e M15 podem ter mais pontos de entrada falsos.
Open chart in a new window


