Actual patterns

Patterns are graphical models which are formed in the chart by the price. According to one of the technical analysis postulates, history (price movement) repeats itself. It means that the price movements are often similar in the same situations which makes it possible to predict the further development of the situation with a high probability.
Relevant patterns by InstaTrade is an easy-to-use service which allows you to be aware of latest changes in the market and react to clues from the market in time. In our service you will always find the latest and most relevant patterns on any pair and any timeframe.
Bullish pennant
was formed on 20.03 at 02:00:19 (UTC+0)
signal strength 2 of 5
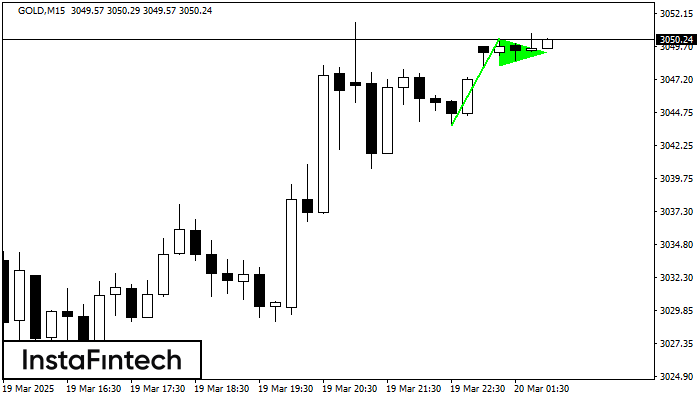
The Bullish pennant graphic pattern has formed on the GOLD M15 instrument. This pattern type falls under the category of continuation patterns. In this case, if the quote can breaks out high, is expected to continue the upward trend to level 3050.52.
The M5 and M15 time frames may have more false entry points.
See Also
- All
- All
- Bearish Rectangle
- Bearish Symmetrical Triangle
- Bearish Symmetrical Triangle
- Bullish Rectangle
- Double Top
- Double Top
- Triple Bottom
- Triple Bottom
- Triple Top
- Triple Top
- All
- All
- Buy
- Sale
- All
- 1
- 2
- 3
- 4
- 5
รูปแบบกราฟธงขาขึ้น (Bullish Flag)
was formed on 28.03 at 22:48:48 (UTC+0)
signal strength 1 of 5

รูปแบบ รูปแบบกราฟธงขาขึ้น (Bullish Flag) ได้สร้างขึ้นมามาในชาร์ต EURUSD M5 ซึ่งแสดงให้เห็นว่า แนวโน้มขาขึ้นจะเกิดขึ้นต่อไป สัญญาณ: การเคลื่อนตัวทะลุผ่านระดับสูงสุดที่ 1.0836 อาจจะผลักดันราคาให้สูงขึ้นกว่าเดิม และการปรับตัวขึ้นจะเป็นระยะทางไปยังตัวเสา
ขอบเตระยะเวลาใน M5 และ M15 อาจจะมีตำแหน่งการเข้าใช้งานที่ผิดพลาดมากยิ่งขึ้น
Open chart in a new window
รูปแบบกราฟธงปลายแหลมขาขึ้น (Bullish pennant)
was formed on 28.03 at 22:48:43 (UTC+0)
signal strength 1 of 5
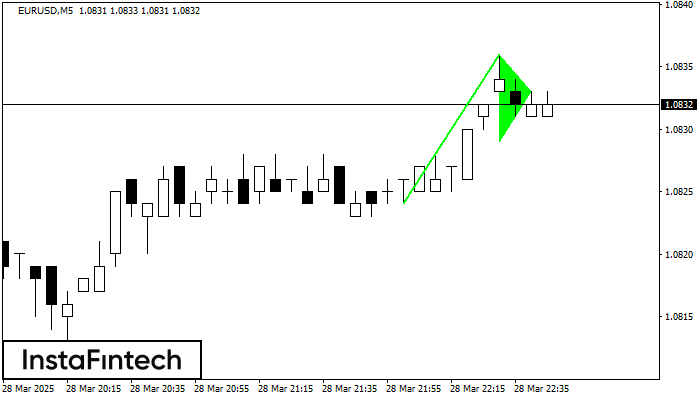
รูปแบบกราฟิก รูปแบบกราฟธงปลายแหลมขาขึ้น (Bullish pennant) ได้สร้างขึ้นมาในตราสาร EURUSD M5 รูปแบบประเภทนี้จะอยู่ใน ประเภทของรูปแบบต่อเนื่อง ในกรณีเช่นนี้ ถ้าหากมูลค่าสามารถเคลื่อนตัวทะลุผ่านระดับสูงออกไปได้ ก็คาดการณ์ว่าจะยังเคลื่อนตัวไปยังแนวโน้มขาขึ้นที่ระดับ 1.0851
ขอบเตระยะเวลาใน M5 และ M15 อาจจะมีตำแหน่งการเข้าใช้งานที่ผิดพลาดมากยิ่งขึ้น
Open chart in a new window
รูปแบบกราฟสี่เหลี่ยมผืนผ้าขาขึ้น (Bullish Rectangle)
was formed on 28.03 at 22:34:02 (UTC+0)
signal strength 3 of 5

อ้างอิงจากชาร์ตของ M30, GOLD ที่ได้สร้างรูปแบบ รูปแบบกราฟสี่เหลี่ยมผืนผ้าขาขึ้น (Bullish Rectangle) ออกมา ซึ่งเป็นรูปแบบของความต่อเนื่องในแนวโน้ม รูปแบบนี้จะอยู่ในขอบเขตตามนี้: ขอบเขตด้านล่าง 3065.51 – 3065.51
Open chart in a new window