Vea también


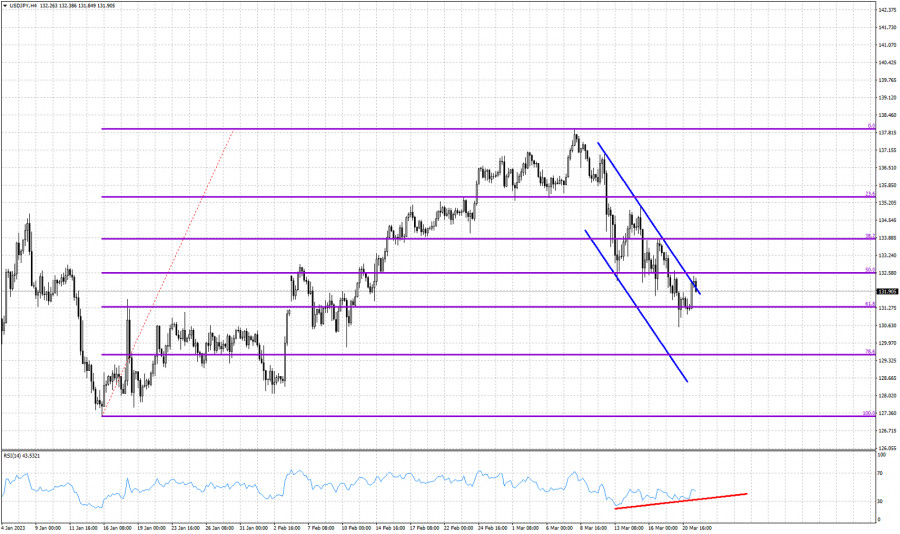
Líneas azules - canal bajista
Línea roja - divergencia RSI alcista
Líneas violetas - retrocesos de Fibonacci
En nuestro análisis del USDJPY de ayer notamos que había mayores posibilidades de un rebote. El precio hizo un mínimo en 130.56 y ahora está desafiando el límite superior del canal. El precio técnicamente permanece en una tendencia bajista ya que todavía está dentro del canal de pendiente descendente. Sin embargo, el precio ha comenzado a formar máximos y mínimos más altos. La divergencia alcista del RSI, combinada con una reversión del retroceso de Fibonacci del 61,8%, podría producir una señal alcista explosiva si el precio logra superar el canal bajista. El soporte se encuentra en el mínimo de 131.05 que hicimos hoy. Los toros necesitan defender este nivel. El no hacerlo empujará el precio a nuevos mínimos hacia 130-129.
You have already liked this post today
*El análisis de mercado publicado aquí tiene la finalidad de incrementar su conocimiento, más no darle instrucciones para realizar una operación.


Ferrari F8 TRIBUTO
de InstaForex
InstaForex en cifras

Your IP address shows that you are currently located in the USA. If you are a resident of the United States, you are prohibited from using the services of InstaFintech Group including online trading, online transfers, deposit/withdrawal of funds, etc.
If you think you are seeing this message by mistake and your location is not the US, kindly proceed to the website. Otherwise, you must leave the website in order to comply with government restrictions.
Why does your IP address show your location as the USA?
Please confirm whether you are a US resident or not by clicking the relevant button below. If you choose the wrong option, being a US resident, you will not be able to open an account with InstaTrade anyway.
We are sorry for any inconvenience caused by this message.

