Patrones actuales

Los patrones son modelos gráficos que se forman en el gráfico mediante el precio. Según uno de los postulados del análisis técnico, la historia (movimiento del precio) se repite. Esto quiere decir que los movimientos del precio a menudo son similares en las mismas situaciones que hacen posible pronosticar el futuro desarrollo de la situación con una alta probabilidad.
Los patrones relevantes de InstaTrade son un servicio fácil de utilizar que permiten que conozca los últimos cambios en el mercado y reaccione a las pistas del mercado a tiempo. En nuestro servicio, siempre encontrará los últimos y más importantes patrones en cualquier par y en cualquier marco de tiempo.
Bullish pennant
was formed on 03.04 at 20:00:31 (UTC+0)
signal strength 3 of 5
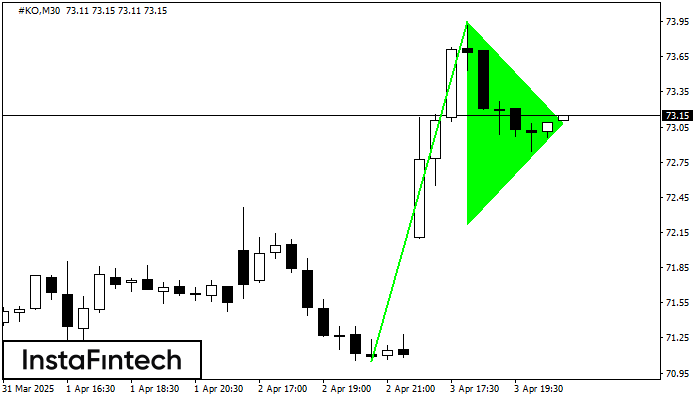
The Bullish pennant signal – Trading instrument #KO M30, continuation pattern. Forecast: it is possible to set up a buy position above the pattern’s high of 73.95, with the prospect of the next move being a projection of the flagpole height.
- All
- All
- Bearish Rectangle
- Bearish Symmetrical Triangle
- Bearish Symmetrical Triangle
- Bullish Rectangle
- Double Top
- Double Top
- Triple Bottom
- Triple Bottom
- Triple Top
- Triple Top
- All
- All
- Buy
- Sale
- All
- 1
- 2
- 3
- 4
- 5
Triángulo Simétrico Alcista
was formed on 22.04 at 00:32:37 (UTC+0)
signal strength 1 of 5

Según el gráfico de M5, el GBPAUD formó el patrón Triángulo Simétrico Alcista. El límite inferior del patrón toca las coordenadas 2.0825/2.0852 donde el límite superior cruza 2.0880/2.0852
Los marcos de tiempo M5 y M15 pueden tener más puntos de entrada falsos.
Open chart in a new window
Triángulo Simétrico Alcista
was formed on 22.04 at 00:30:42 (UTC+0)
signal strength 1 of 5

Según el gráfico de M5, AUDCAD formó el patrón Triángulo Simétrico Alcista. Descripción: Este es el patrón de la continuación de una tendencia. 0.8879 y 0.8869 son las coordenadas
Los marcos de tiempo M5 y M15 pueden tener más puntos de entrada falsos.
Open chart in a new window
Triángulo Simétrico Bajista
was formed on 22.04 at 00:27:05 (UTC+0)
signal strength 3 of 5

Según el gráfico de M30, el USDJPY formó el patrón Triángulo Simétrico Bajista. Este patrón señala una tendencia bajista en caso de que el límite inferior 140.49 sea roto. Aquí
Open chart in a new window