Patrones actuales

Los patrones son modelos gráficos que se forman en el gráfico mediante el precio. Según uno de los postulados del análisis técnico, la historia (movimiento del precio) se repite. Esto quiere decir que los movimientos del precio a menudo son similares en las mismas situaciones que hacen posible pronosticar el futuro desarrollo de la situación con una alta probabilidad.
Los patrones relevantes de InstaTrade son un servicio fácil de utilizar que permiten que conozca los últimos cambios en el mercado y reaccione a las pistas del mercado a tiempo. En nuestro servicio, siempre encontrará los últimos y más importantes patrones en cualquier par y en cualquier marco de tiempo.
Bullish Symmetrical Triangle
was formed on 15.04 at 23:00:56 (UTC+0)
signal strength 2 of 5

According to the chart of M15, AUDJPY formed the Bullish Symmetrical Triangle pattern, which signals the trend will continue. Description. The upper border of the pattern touches the coordinates 91.35/91.01 whereas the lower border goes across 90.50/91.01. The pattern width is measured on the chart at 85 pips. If the Bullish Symmetrical Triangle pattern is in progress during the upward trend, this indicates the current trend will go on. In case 91.01 is broken, the price could continue its move toward 91.24.
The M5 and M15 time frames may have more false entry points.
Vea asimismo
- All
- All
- Bearish Rectangle
- Bearish Symmetrical Triangle
- Bearish Symmetrical Triangle
- Bullish Rectangle
- Double Top
- Double Top
- Triple Bottom
- Triple Bottom
- Triple Top
- Triple Top
- All
- All
- Buy
- Sale
- All
- 1
- 2
- 3
- 4
- 5
Double Bottom
was formed on 22.04 at 05:55:18 (UTC+0)
signal strength 1 of 5
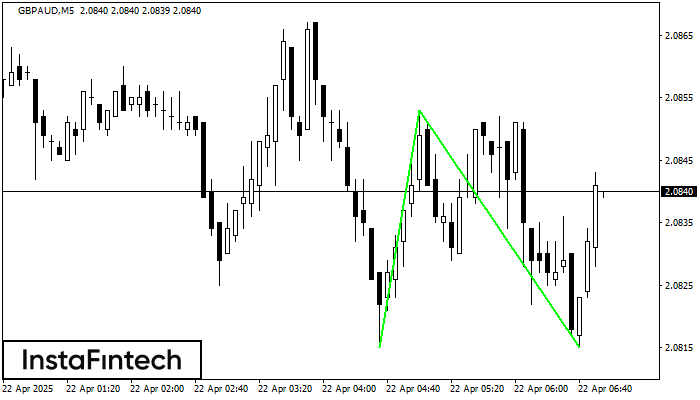
Corak Double Bottom telah dibentuk pada GBPAUD M5. Ciri-ciri: tahap sokongan 2.0815; tahap rintangan 2.0853; lebar corak 38 mata. Sekiranya tahap rintangan ditembusi, perubahan aliran boleh diramalkan dengan titik sasaran
Carta masa M5 dan M15 mungkin mempunyai lebih banyak titik kemasukan palsu.
Open chart in a new window
Double Top
was formed on 22.04 at 04:35:45 (UTC+0)
signal strength 1 of 5

Corak pembalikan Double Top telah dibentuk pada NZDCHF M5. Ciri-ciri: sempadan atas %P0.000000; sempadan bawah 0.4869; sempadan bawah 0.4861; lebar corak adalah 7 mata. Dagangan menjual adalah lebih baik untuk
Carta masa M5 dan M15 mungkin mempunyai lebih banyak titik kemasukan palsu.
Open chart in a new window
Flag Aliran Menurun
was formed on 22.04 at 04:22:30 (UTC+0)
signal strength 1 of 5

Corak Flag Aliran Menurun telah dibentuk pada carta SILVER M5. Oleh demikian, aliran menurun mungkin akan berterusan dalam tempoh terdekat. Sebaik sahaja harga menembusi di bawah yang rendah pada 32.48
Carta masa M5 dan M15 mungkin mempunyai lebih banyak titik kemasukan palsu.
Open chart in a new window