อ่านรายละเอียดเพิ่มเติม


 18.07.2022 10:35 AM
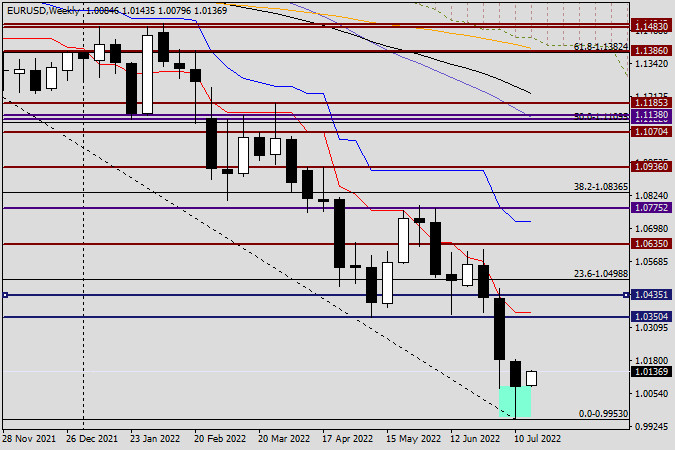
Consequently, during the 11–15 June auction, the EUR/USD currency pair maintained its downward trend, reaching a price of 0.9953. In a moment, we'll examine the technical picture of the primary currency pair in further detail; for now, we'll speak briefly about other data. This week, the European Central Bank will hold a meeting, after which a decision will be taken about interest rates. The mainstream expectation assumes that the ECB will raise the key interest rate by 25 basis points. However, will this be sufficient to convince the market of the decisiveness of tightening monetary policy to confront high inflation? It may be the fundamental question determining the future of the most important currency pair in the Forex market. According to the author's personal opinion, such a tardy and previously publicized hike in the key rate has already been factored into the price of the single European currency, and if that is the case, then support for the euro from this decision of the European Central Bank is unlikely. Nonetheless, the technical picture indicates a potential reversal of the euro/dollar, at least for a corrective drop. The EUR/USD weekly chart is studied.
Weekly
On the weekly timescale, a candle with a suitably long-emphasized lower shadow has been generated based on the trading activity of the previous five days. The fact that this candle arose after attempting to fall below the most significant psychological and historical threshold of 1.0000 is a defining aspect of its appearance. Now that so much has been written about the accomplishment of EUR/USD parity, it has finally captured the attention of market participants. Last week, the price closed at 1.0078 after bouncing off this key level. This week's trading begins at a time when euro bulls are attempting to continue reducing the previous large losses. Given the long lower shadow of the previous candle and the impending ECB rate hike, I believe the major currency pair has a chance of exhibiting an upward trend based on the outcomes of trading over the past five days.Nevertheless, a great deal will depend on the words of ECB leaders. If a clear signal is received regarding a further and more forceful tightening of monetary policy, the probability of a last weekly increase will unquestionably increase. Without ECB support, it is doubtful that the single European currency will require support. On a weekly price chart, the region between 1.0350 and 1.0370 appears to be the closest growth objective. If the bearish trend continues, the bears will retest the 0.9953 minimum value from the previous week for a potential breakdown.
Daily
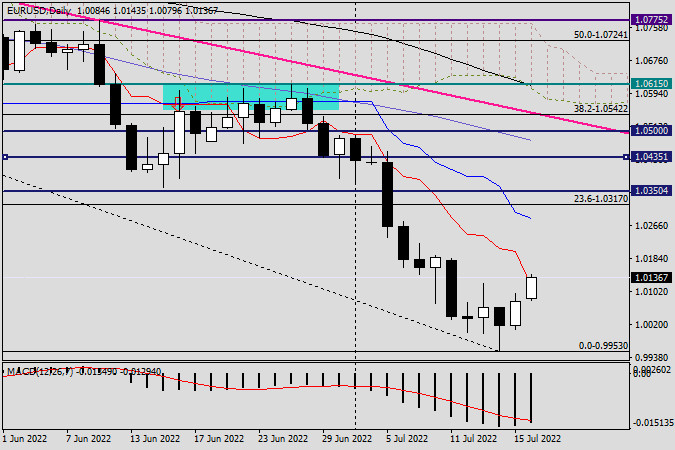
On the daily chart, the red Tenkan line of the Ichimoku indicator is being tested for a break higher during the current upward trend. If these efforts are successful, the pair may ascend to the blue Kijun line, which is located at 1.0284. I believe the capacity to climb the Kijun will play a significant role. Despite the negative trend in EUR/USD, I will not be shocked by the ensuing upward movement, which should still be deemed corrective. Tomorrow's article will examine smaller time intervals to identify favorable entry points for euro/dollar bets. Given the discussed timelines, I lean toward a positive scenario.
You have already liked this post today
*บทวิเคราะห์ในตลาดที่มีการโพสต์ตรงนี้ เพียงเพื่อทำให้คุณทราบถึงข้อมูล ไม่ได้เป็นการเจาะจงถึงขั้นตอนให้คุณทำการซื้อขายตาม
ลิงก์ที่มีประโยชน์: บทความอื่นๆ ของฉันมีอยู่ในส่วนนี้ คอร์ส InstaForex สำหรับผู้เริ่มต้น การวิเคราะห์ยอดนิยม เปิดบัญชีซื้อขาย สำคัญ: ผู้เริ่มต้นในการซื้อขายฟอเร็กซ์ควรระมัดระวังอย่างยิ่งเมื่อตัดสินใจเกี่ยวกับการเข้าสู่ตลาด ก่อนที่จะมีการเปิดเผยรายงานสำคัญ ขอแนะนำให้อยู่ห่างจากตลาดเพื่อหลีกเลี่ยงความผันผวนที่เกิดขึ้นอย่างรวดเร็วจากการเปลี่ยนแปลงการเคลื่อนไหวราคา ถ้าคุณตัดสินใจที่จะซื้อขายในช่วงเวลาที่มีการเผยแพร่ข่าว ควรวางคำสั่งหยุดการขาดทุนเสมอเพื่อจำกัดการสูญเสียให้มีความเสี่ยงน้อยที่สุด หากไม่ได้วางคำสั่งหยุดการขาดทุน
ในช่วงต้นของเซสชั่นอเมริกา คู่สกุลเงิน EUR/USD กำลังซื้อขายอยู่ที่ระดับ 1.1358 ภายในช่องแนวโน้มขาลงที่เริ่มเมื่อวันที่ 18 เมษายน คู่สกุลเงินนี้ยังถูกกดดันจากแรงขาย เราเชื่อว่าเครื่องมือการเงินนี้ยังมีทางลงอีกยาวไกลกว่าจะถึงก้นของช่องแนวโน้มขาลง ยูโรคาดว่าจะฟื้นตัวในชั่วโมงต่อๆ ไป และขึ้นไปถึงระดับ 1.1429 บนกราฟ
ลิงก์ที่มีประโยชน์: บทความอื่นๆ ของฉันสามารถอ่านได้ในส่วนนี้ คอร์ส InstaForex สำหรับผู้เริ่มต้น การวิเคราะห์ยอดนิยม เปิดบัญชีซื้อขาย สำคัญ: นักลงทุนมือใหม่ในตลาดฟอเร็กซ์จำเป็นต้องระมัดระวังอย่างมากเมื่อตัดสินใจเข้าตลาด ก่อนการเปิดเผยรายงานสำคัญควรหลีกเลี่ยงการเข้าไปในตลาดเพื่อหลบเลี่ยงความผันผวนที่รุนแรง อันเนื่องมาจากความผันแปรที่เพิ่มขึ้น หากคุณตัดสินใจที่จะเทรดในช่วงที่มีการเผยแพร่ข่าวสาร ควรตั้งคำสั่งหยุดขาดทุนเสมอเพื่อช่วยลดความเสี่ยงในการขาดทุน หากไม่มีการตั้งคำสั่งหยุดขาดทุน
ราคาทองคำได้ปรับตัวลดลงอย่างชัดเจนเมื่อเร็วๆ นี้ ท่ามกลางความคาดหวังในตลาดเกี่ยวกับการเริ่มต้นการเจรจาจริงระหว่างสหรัฐฯ และจีน เรื่องภาษีและการค้าภาพรวม คำแถลงของรัฐมนตรีคลัง S. Bessent ที่กล่าวว่าการทำสงครามภาษีในปัจจุบันระหว่างปักกิ่งและวอชิงตันไม่มีประโยชน์ บ่งบอกว่าการเจรจากำลังเกิดขึ้นเบื้องหลัง และอาจมีการบรรลุข้อตกลงในอนาคตอันใกล้นี้ ในทางเทคนิค ราคาของ "โลหะสีเหลือง" มีการกลับตัวลงในท้องถิ่น
ในกราฟ 4 ชั่วโมง เครื่องมือที่ใช้สำหรับการซื้อขายเงิน (Silver) แสดงให้เห็นสภาพที่กำลังแข็งแกร่งขึ้น ซึ่งยืนยันได้จากการเคลื่อนไหวของราคาเงินที่เคลื่อนที่อยู่เหนือเส้น WMA (30 Shift 2) ที่มีแนวโน้มขึ้น แต่การปรากฎของ Divergence ระหว่างการเคลื่อนที่ของราคาและตัวบ่งชี้
แม้ว่าในกราฟ 4 ชั่วโมง ดัชนี Nasdaq 100 จะอยู่ในทิศทาง Sideways แต่ช่วงช่วงนั้นค่อนข้างกว้างจึงยังมีโอกาสที่ค่อนข้างน่าสนใจในดัชนีนี้ ขณะนี้ตัวชี้วัด Stochastic Oscillator อยู่ในสภาวะ Crossing SELL
ในช่วงต้นของตลาดสหรัฐฯ ทองคำมีการซื้อขายอยู่ที่ประมาณ 3,333 ภายในช่องขาลงที่เกิดขึ้นเมื่อวันที่ 22 เมษายน XAU/USD แสดงสัญญาณของการขายเกินและกำลังกระเด้งหลังจากถึงระดับ Murray 6/8 และพื้นที่ 200 EMA ทองคำอาจจะยังคงอยู่ในแนวโน้มขาลง ถ้ามันลดลงต่ำกว่า
ด้วยการเกิดความแตกต่างระหว่างการเคลื่อนไหวของราคาในคู่สกุลเงิน AUD/JPY กับตัวบ่งชี้ Stochastic Oscillator และการเคลื่อนไหวของราคา AUD/JPY ที่อยู่เหนือ WMA (30 Shift 2) ซึ่งมีแนวโน้มสูงขึ้น ดังนั้นอิงตามข้อเท็จจริงทั้งสองข้อนี้ AUD/JPY
หากเราพิจารณากราฟ 4 ชั่วโมง จะเห็นว่าเครื่องมือการเงิน Gold ยังคงเคลื่อนไหวในแนวโน้ม Bullish แต่การปรากฏของ Divergence ระหว่างการเคลื่อนไหวของราคาทองคำกับตัวชี้วัด Stochastic Oscillator บ่งบอกว่าในอนาคตอันใกล้นี้ ทองคำอาจเผชิญการปรับฐานอ่อนตัวลงไปสู่ระดับ 3310.31
ลิงก์ที่เป็นประโยชน์: บทความอื่นๆ ของฉันสามารถอ่านได้ในส่วนนี้ คอร์สพื้นฐาน InstaForex สำหรับผู้เริ่มต้น การวิเคราะห์ยอดนิยม เปิดบัญชีซื้อขาย สำคัญ: สำหรับผู้เริ่มต้นในการเทรดฟอเร็กซ์ ควรระมัดระวังเป็นพิเศษเมื่อทำการตัดสินใจเกี่ยวกับการเข้าสู่ตลาด ก่อนที่รายงานสำคัญจะออก ควรหลีกเลี่ยงการเข้าตลาดเพื่อป้องกันการถูกกระทบจากความผันผวนของตลาดที่เพิ่มขึ้น หากตัดสินใจเทรดในช่วงที่มีการประกาศข่าว ควรตั้ง
สมาชิกInstaForex

Your IP address shows that you are currently located in the USA. If you are a resident of the United States, you are prohibited from using the services of InstaFintech Group including online trading, online transfers, deposit/withdrawal of funds, etc.
If you think you are seeing this message by mistake and your location is not the US, kindly proceed to the website. Otherwise, you must leave the website in order to comply with government restrictions.
Why does your IP address show your location as the USA?
Please confirm whether you are a US resident or not by clicking the relevant button below. If you choose the wrong option, being a US resident, you will not be able to open an account with InstaTrade anyway.
We are sorry for any inconvenience caused by this message.


