Dolzarb patternlar

Двойное дно
сформирован 20.03 в 02:40:21 (UTC+0)
сила сигнала 1 из 5
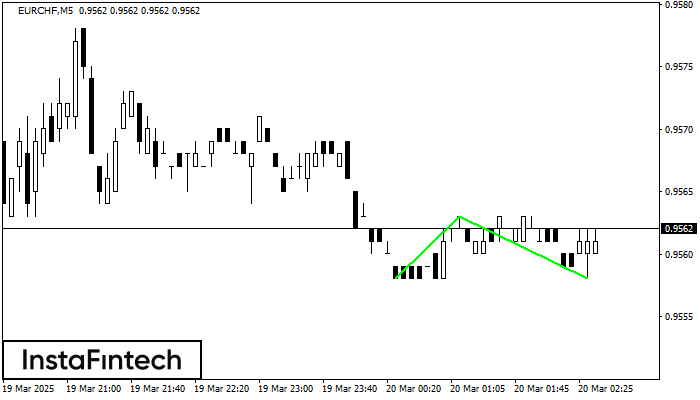
Сформирована фигура «Двойное дно» на графике EURCHF M5. Верхняя граница 0.9563; Нижняя граница 0.9558; Ширина фигуры 5 пунктов. В случае пробоя верхней границы 0.9563 можно будет прогнозировать изменение тенденции, где ширина фигуры и будет являться расстоянием предположительного Тейк Профита.
Таймфреймы М5 и М15 могут иметь больше ложных точек входа.
- Все
- Все
- Bearish Rectangle
- Bearish Symmetrical Triangle
- Bearish Symmetrical Triangle
- Bullish Rectangle
- Double Top
- Double Top
- Triple Bottom
- Triple Bottom
- Triple Top
- Triple Top
- Все
- Все
- Покупка
- Продажа
- Все
- 1
- 2
- 3
- 4
- 5
Bullish Symmetrical Triangle
сформирован 21.03 в 13:36:59 (UTC+0)
сила сигнала 1 из 5
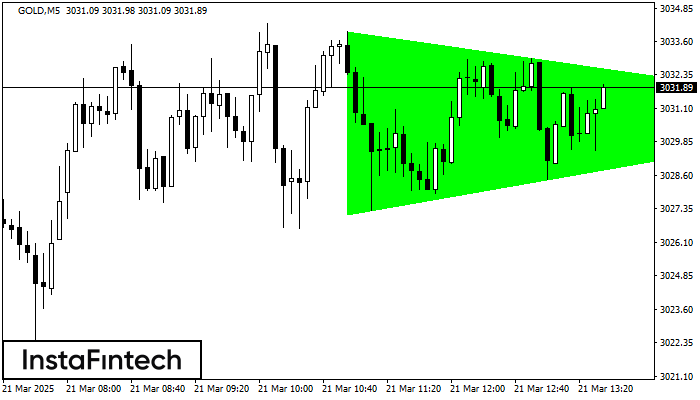
According to the chart of M5, GOLD formed the Bullish Symmetrical Triangle pattern. The lower border of the pattern touches the coordinates 3027.13/3030.88 whereas the upper border goes across 3033.97/3030.88
The M5 and M15 time frames may have more false entry points.
Открыть график инструмента в новом окне
Triple Bottom
сформирован 21.03 в 13:30:17 (UTC+0)
сила сигнала 3 из 5
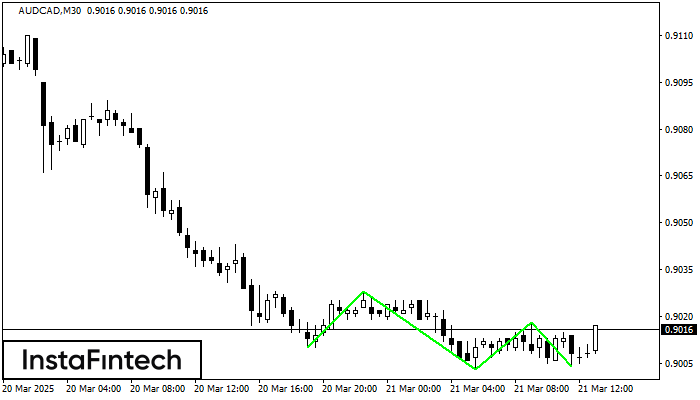
The Triple Bottom pattern has been formed on AUDCAD M30. It has the following characteristics: resistance level 0.9028/0.9018; support level 0.9010/0.9004; the width is 18 points. In the event
Открыть график инструмента в новом окне
Double Bottom
сформирован 21.03 в 13:00:55 (UTC+0)
сила сигнала 3 из 5
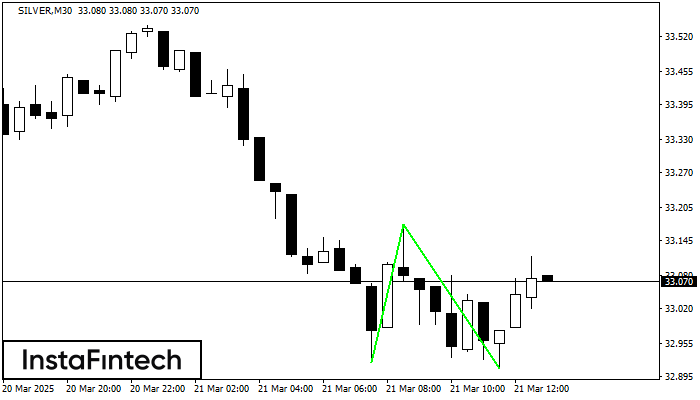
The Double Bottom pattern has been formed on SILVER M30. This formation signals a reversal of the trend from downwards to upwards. The signal is that a buy trade should
Открыть график инструмента в новом окне