Dolzarb patternlar

Прямоугольник
сформирован 21.03 в 00:40:12 (UTC+0)
сила сигнала 2 из 5
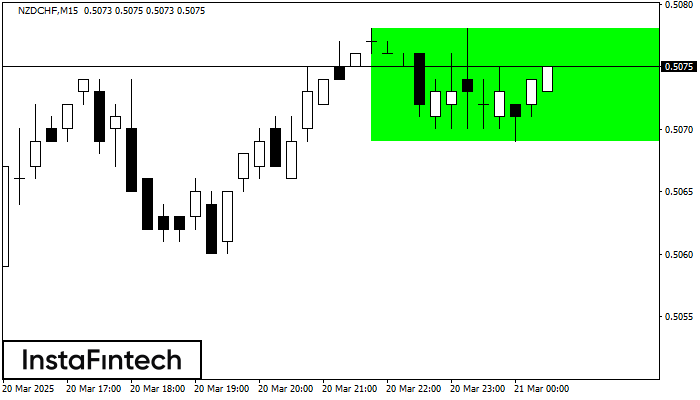
Сформирована фигура «Прямоугольник» на графике NZDCHF M15. Тип фигуры: Продолжение тренда; Границы: Верхняя 0.5078, Нижняя 0.5069; Сигнал: позицию на покупку следует открывать выше верхней границы прямоугольника 0.5078.
Таймфреймы М5 и М15 могут иметь больше ложных точек входа.
- Все
- Все
- Bearish Rectangle
- Bearish Symmetrical Triangle
- Bearish Symmetrical Triangle
- Bullish Rectangle
- Double Top
- Double Top
- Triple Bottom
- Triple Bottom
- Triple Top
- Triple Top
- Все
- Все
- Покупка
- Продажа
- Все
- 1
- 2
- 3
- 4
- 5
Double Bottom
was formed on 21.04 at 18:15:42 (UTC+0)
signal strength 2 of 5
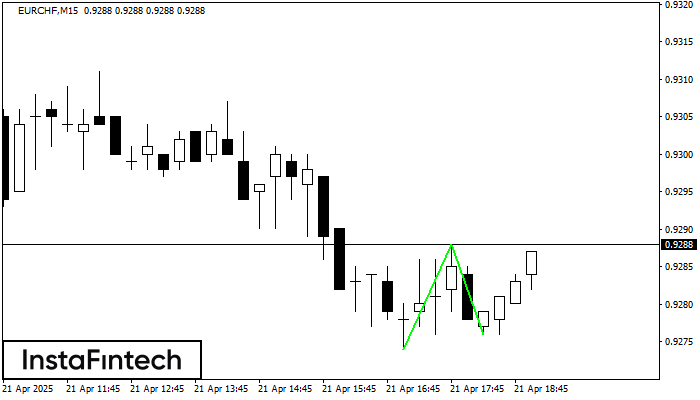
The Double Bottom pattern has been formed on EURCHF M15. This formation signals a reversal of the trend from downwards to upwards. The signal is that a buy trade should
The M5 and M15 time frames may have more false entry points.
Open chart in a new window
Triple Bottom
was formed on 21.04 at 18:09:56 (UTC+0)
signal strength 1 of 5
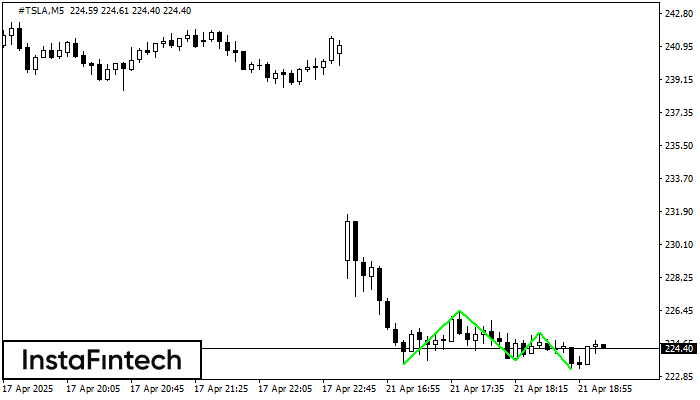
The Triple Bottom pattern has formed on the chart of the #TSLA M5 trading instrument. The pattern signals a change in the trend from downwards to upwards in the case
The M5 and M15 time frames may have more false entry points.
Open chart in a new window
Triple Bottom
was formed on 21.04 at 18:09:35 (UTC+0)
signal strength 1 of 5
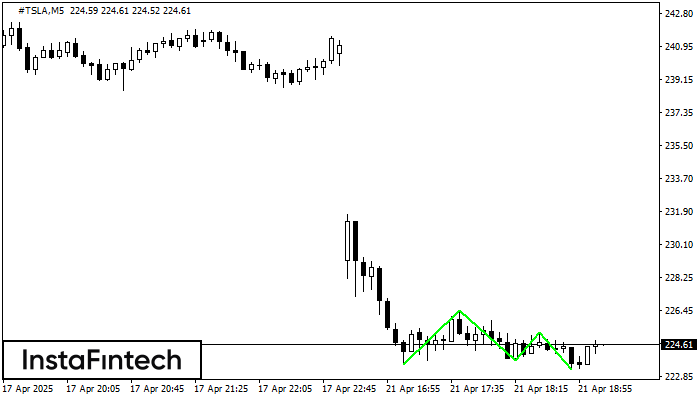
The Triple Bottom pattern has formed on the chart of the #TSLA M5 trading instrument. The pattern signals a change in the trend from downwards to upwards in the case
The M5 and M15 time frames may have more false entry points.
Open chart in a new window