Dolzarb patternlar

Медвежий вымпел
сформирован 26.03 в 00:04:30 (UTC+0)
сила сигнала 3 из 5
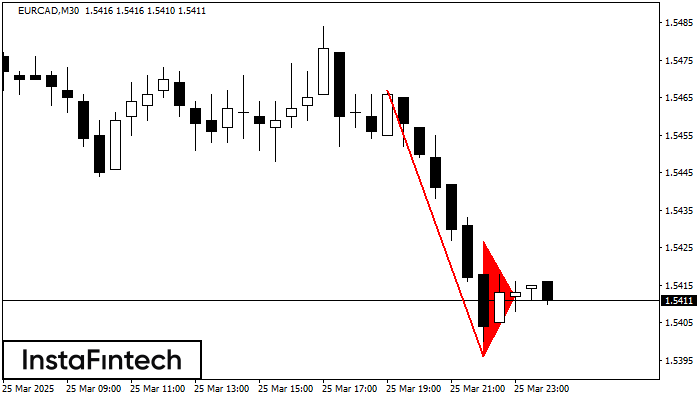
На графике EURCAD M30 сформировалась фигура «Медвежий вымпел». Фигура сигнализирует о продолжении нисходящего тренда в случае пробоя минимума вымпела 1.5396. Рекомендации: Отложенный ордер Sell Stop выставляется на 10 пунктов ниже минимума фигуры. Тейк Профит выставляется на расстояние проекции высоты флагштока.
- Все
- Все
- Bearish Rectangle
- Bearish Symmetrical Triangle
- Bearish Symmetrical Triangle
- Bullish Rectangle
- Double Top
- Double Top
- Triple Bottom
- Triple Bottom
- Triple Top
- Triple Top
- Все
- Все
- Покупка
- Продажа
- Все
- 1
- 2
- 3
- 4
- 5
Triple Bottom
was formed on 21.04 at 22:01:24 (UTC+0)
signal strength 3 of 5

The Triple Bottom pattern has formed on the chart of the USDJPY M30 trading instrument. The pattern signals a change in the trend from downwards to upwards in the case
Open chart in a new window
Double Bottom
was formed on 21.04 at 22:00:49 (UTC+0)
signal strength 4 of 5

The Double Bottom pattern has been formed on AUDCHF H1; the upper boundary is 0.5198; the lower boundary is 0.5165. The width of the pattern is 34 points. In case
Open chart in a new window
Bearish Symmetrical Triangle
was formed on 21.04 at 21:58:31 (UTC+0)
signal strength 1 of 5
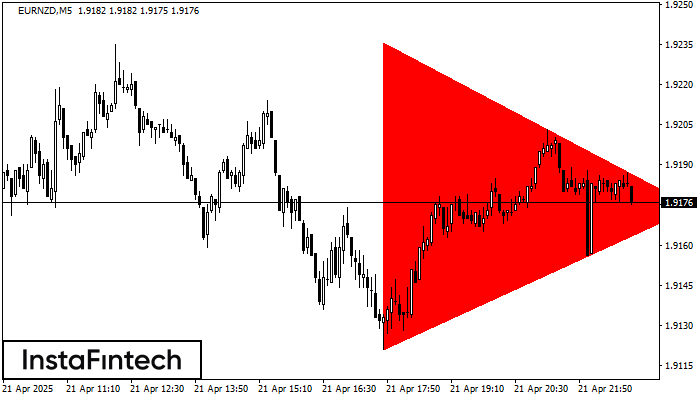
According to the chart of M5, EURNZD formed the Bearish Symmetrical Triangle pattern. Description: The lower border is 1.9121/1.9174 and upper border is 1.9236/1.9174. The pattern width is measured
The M5 and M15 time frames may have more false entry points.
Open chart in a new window