Dolzarb patternlar

Двойная вершина
сформирован 31.03 в 04:40:34 (UTC+0)
сила сигнала 1 из 5
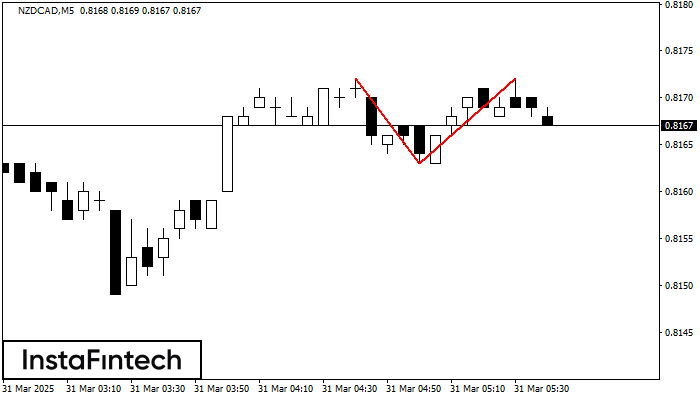
На торговом графике NZDCAD M5 сформировалась разворотная фигура «Двойная вершина». Характеристика: Верхняя граница 0.8172; Нижняя граница 0.8163; Ширина фигуры 9 пунктов. Сигнал: Пробой нижней границы 0.8163 приведет к дальнейшему нисходящему движению с перспективой хода к уровню 0.8148.
Таймфреймы М5 и М15 могут иметь больше ложных точек входа.
- Все
- Все
- Bearish Rectangle
- Bearish Symmetrical Triangle
- Bearish Symmetrical Triangle
- Bullish Rectangle
- Double Top
- Double Top
- Triple Bottom
- Triple Bottom
- Triple Top
- Triple Top
- Все
- Все
- Покупка
- Продажа
- Все
- 1
- 2
- 3
- 4
- 5
Bearish pennant
was formed on 21.04 at 21:30:29 (UTC+0)
signal strength 4 of 5

The Bearish pennant pattern has formed on the #FB H1 chart. This pattern type is characterized by a slight slowdown after which the price will move in the direction
Open chart in a new window
Triple Bottom
was formed on 21.04 at 21:30:21 (UTC+0)
signal strength 2 of 5

The Triple Bottom pattern has been formed on #AAPL M15. It has the following characteristics: resistance level 191.73/191.10; support level 189.80/190.18; the width is 193 points. In the event
The M5 and M15 time frames may have more false entry points.
Open chart in a new window
Double Top
was formed on 21.04 at 21:30:13 (UTC+0)
signal strength 2 of 5
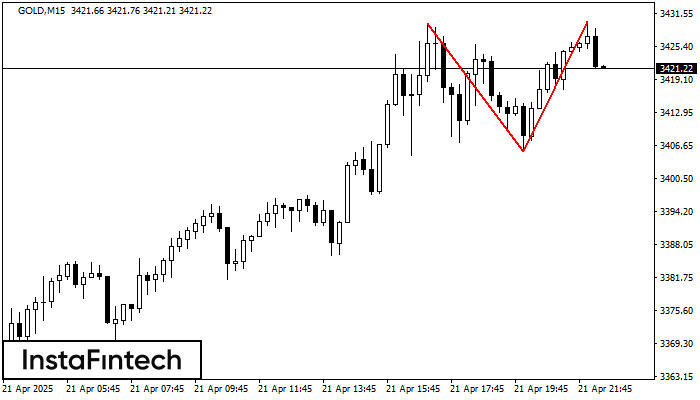
The Double Top reversal pattern has been formed on GOLD M15. Characteristics: the upper boundary 3429.80; the lower boundary 3405.54; the width of the pattern is 2449 points. Sell trades
The M5 and M15 time frames may have more false entry points.
Open chart in a new window