Dolzarb patternlar

Двойная вершина
сформирован 01.04 в 07:00:06 (UTC+0)
сила сигнала 1 из 5
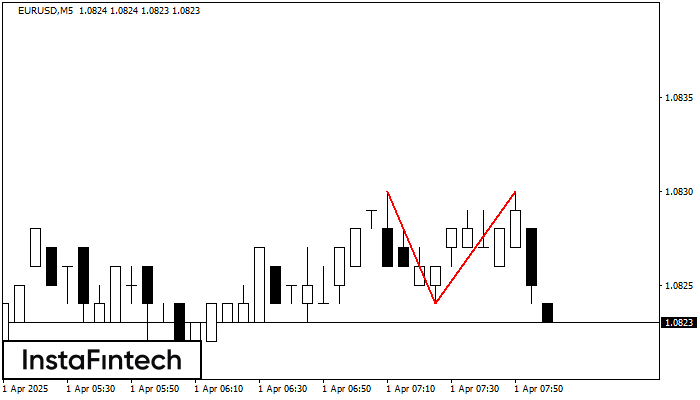
По торговому инструменту EURUSD на M5 сформировалась фигура «Двойная вершина», которая сигнализирует нам об изменении тенденции с восходящей на нисходящую. Вероятно, что, в случае пробоя основания фигуры 1.0824, возможно дальнейшее нисходящее движение.
Таймфреймы М5 и М15 могут иметь больше ложных точек входа.
Shuningdek ko'ring
- Все
- Все
- Bearish Rectangle
- Bearish Symmetrical Triangle
- Bearish Symmetrical Triangle
- Bullish Rectangle
- Double Top
- Double Top
- Triple Bottom
- Triple Bottom
- Triple Top
- Triple Top
- Все
- Все
- Покупка
- Продажа
- Все
- 1
- 2
- 3
- 4
- 5
Bullish Symmetrical Triangle
was formed on 21.04 at 14:53:30 (UTC+0)
signal strength 1 of 5

According to the chart of M5, EURUSD formed the Bullish Symmetrical Triangle pattern. The lower border of the pattern touches the coordinates 1.1501/1.1531 whereas the upper border goes across 1.1573/1.1531
The M5 and M15 time frames may have more false entry points.
Open chart in a new window
Double Top
was formed on 21.04 at 14:39:59 (UTC+0)
signal strength 1 of 5
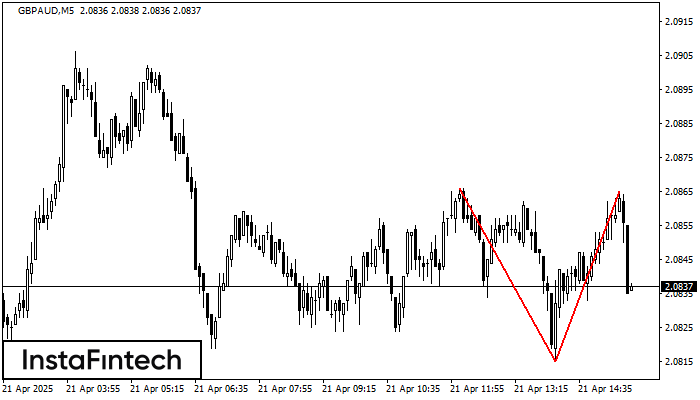
The Double Top reversal pattern has been formed on GBPAUD M5. Characteristics: the upper boundary 2.0866; the lower boundary 2.0815; the width of the pattern is 50 points. Sell trades
The M5 and M15 time frames may have more false entry points.
Open chart in a new window
Triple Top
was formed on 21.04 at 14:30:15 (UTC+0)
signal strength 2 of 5
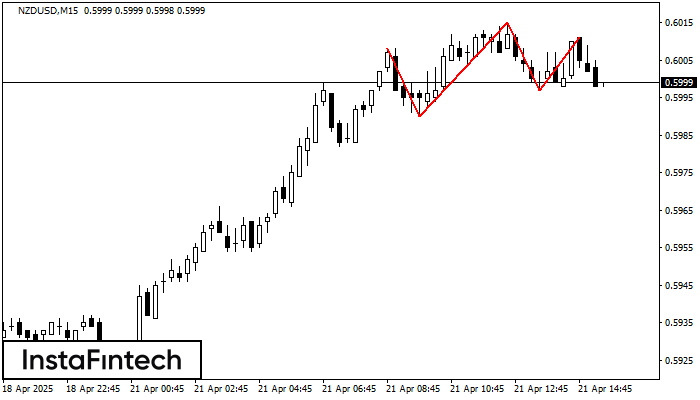
On the chart of the NZDUSD M15 trading instrument, the Triple Top pattern that signals a trend change has formed. It is possible that after formation of the third peak
The M5 and M15 time frames may have more false entry points.
Open chart in a new window