Dolzarb patternlar

Прямоугольник
сформирован 02.04 в 19:45:31 (UTC+0)
сила сигнала 1 из 5
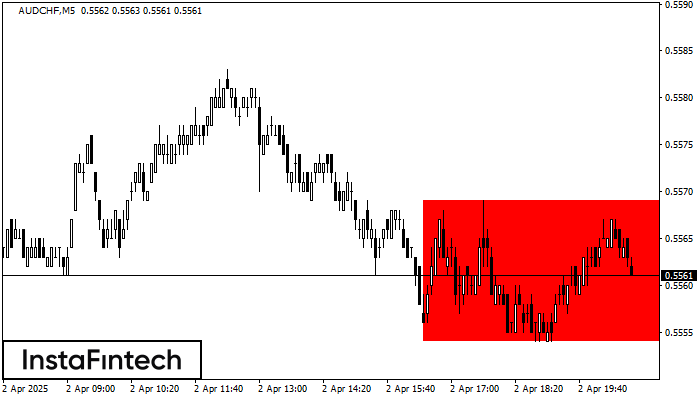
Сформирована фигура «Прямоугольник» на графике AUDCHF M5. Тип фигуры: Продолжение тренда; Границы: Верхняя 0.5569, Нижняя 0.5554; Сигнал: позиция на продажу открывается после фиксации цены ниже границы прямоугольника 0.5554.
Таймфреймы М5 и М15 могут иметь больше ложных точек входа.
- Все
- Все
- Bearish Rectangle
- Bearish Symmetrical Triangle
- Bearish Symmetrical Triangle
- Bullish Rectangle
- Double Top
- Double Top
- Triple Bottom
- Triple Bottom
- Triple Top
- Triple Top
- Все
- Все
- Покупка
- Продажа
- Все
- 1
- 2
- 3
- 4
- 5
Double Top
was formed on 21.04 at 22:26:30 (UTC+0)
signal strength 1 of 5

The Double Top reversal pattern has been formed on AUDCAD M5. Characteristics: the upper boundary 0.8880; the lower boundary 0.8869; the width of the pattern is 11 points. Sell trades
The M5 and M15 time frames may have more false entry points.
Open chart in a new window
Triple Bottom
was formed on 21.04 at 22:01:24 (UTC+0)
signal strength 3 of 5

The Triple Bottom pattern has formed on the chart of the USDJPY M30 trading instrument. The pattern signals a change in the trend from downwards to upwards in the case
Open chart in a new window
Double Bottom
was formed on 21.04 at 22:00:49 (UTC+0)
signal strength 4 of 5

The Double Bottom pattern has been formed on AUDCHF H1; the upper boundary is 0.5198; the lower boundary is 0.5165. The width of the pattern is 34 points. In case
Open chart in a new window