Dolzarb patternlar

Бычий симметричный треугольник
сформирован 05.04 в 06:31:21 (UTC+0)
сила сигнала 2 из 5

По #Bitcoin на M15 сформировалась фигура «Бычий симметричный треугольник». Нижняя граница фигуры имеет координаты 83167.44/83888.94, при этом верхняя граница 84422.11/83888.94. Формирование фигуры «Бычий симметричный треугольник» наиболее вероятным образом свидетельствует о продолжении восходящего тренда. Это означает, что курс #Bitcoin, в случае срабатывания фигуры, пробьет верхнюю границу и направится к значению 83889.16.
Таймфреймы М5 и М15 могут иметь больше ложных точек входа.
Shuningdek ko'ring
- Все
- Все
- Bearish Rectangle
- Bearish Symmetrical Triangle
- Bearish Symmetrical Triangle
- Bullish Rectangle
- Double Top
- Double Top
- Triple Bottom
- Triple Bottom
- Triple Top
- Triple Top
- Все
- Все
- Покупка
- Продажа
- Все
- 1
- 2
- 3
- 4
- 5
Inverse Head and Shoulder
was formed on 09.04 at 19:22:50 (UTC+0)
signal strength 1 of 5
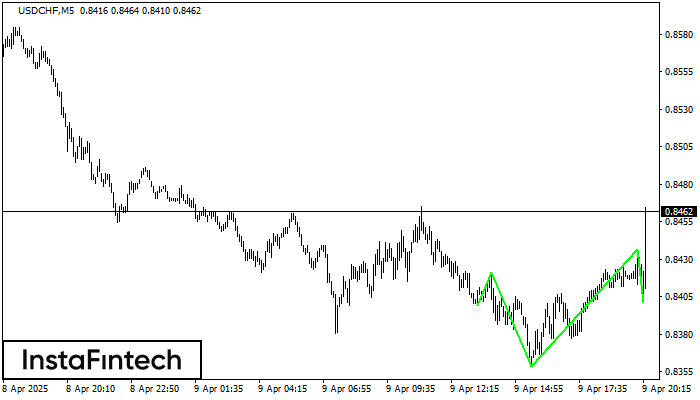
According to the chart of M5, USDCHF formed the Inverse Head and Shoulder pattern. The Head’s top is set at 0.8436 while the median line of the Neck is found
The M5 and M15 time frames may have more false entry points.
Open chart in a new window
Bullish Rectangle
was formed on 09.04 at 18:50:18 (UTC+0)
signal strength 1 of 5
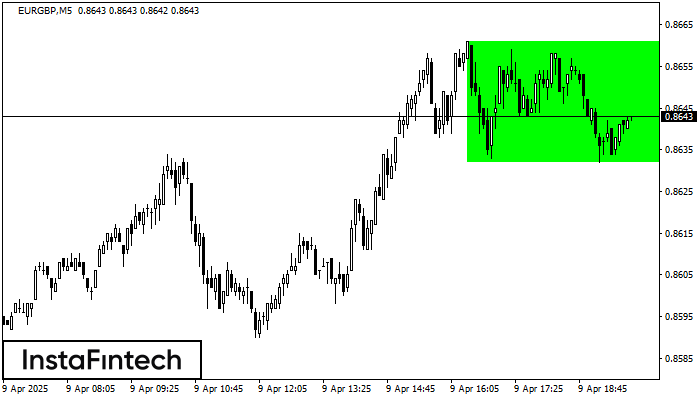
According to the chart of M5, EURGBP formed the Bullish Rectangle which is a pattern of a trend continuation. The pattern is contained within the following borders: the lower border
The M5 and M15 time frames may have more false entry points.
Open chart in a new window
Bearish Rectangle
was formed on 09.04 at 18:48:14 (UTC+0)
signal strength 2 of 5
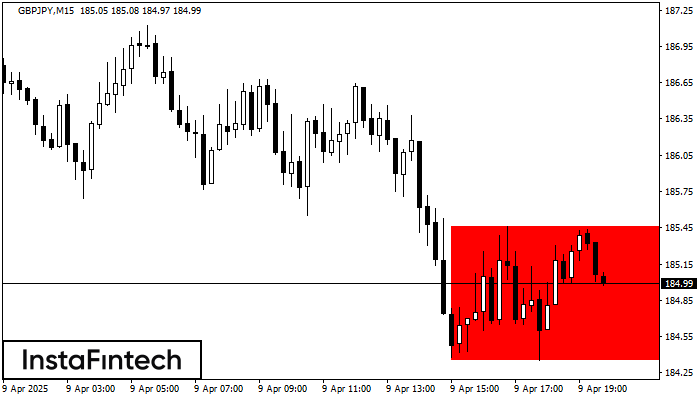
According to the chart of M15, GBPJPY formed the Bearish Rectangle. This type of a pattern indicates a trend continuation. It consists of two levels: resistance 185.46 - 0.00
The M5 and M15 time frames may have more false entry points.
Open chart in a new window